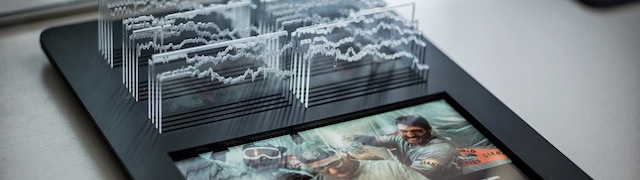
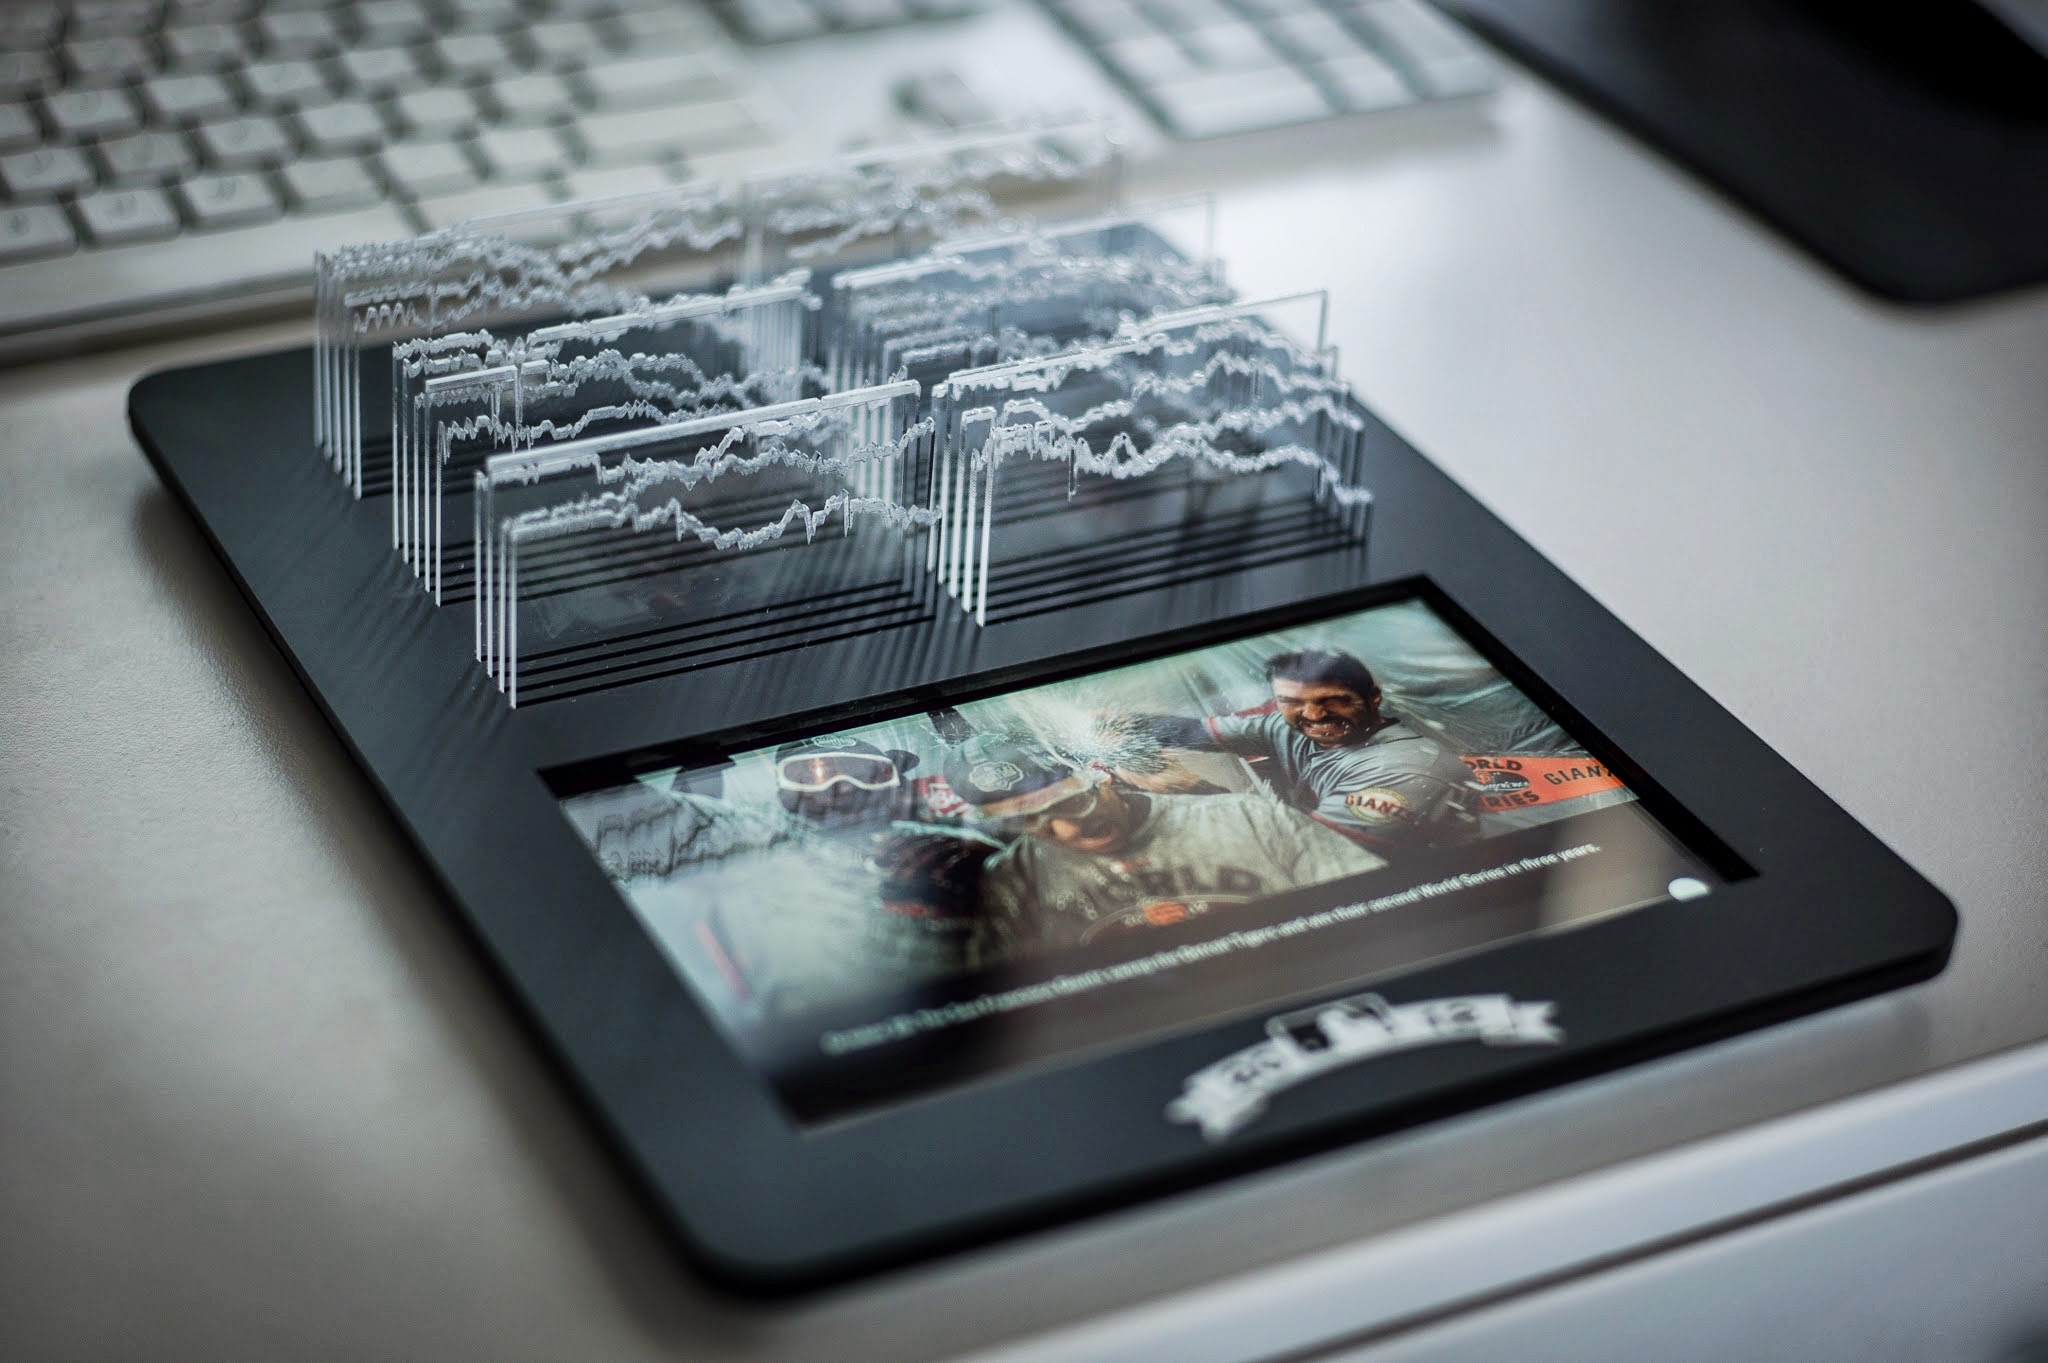
Derived from passion for baseball, Teehan+Lax Labs created an iPad app to display Baseball stats but with a slight twist — the iPad cover that includes graphs cut in acrylic acts as data sculpture accompanying data displayed on the iPad.
Baseball is different from the other big North American sports – it’s slower paced, has a long grueling season, and celebrates its love affair with data and statistics. A few of us at Teehan+Lax are avid baseball fans. We follow the long season in its entirety, take pleasure in armchair GM’ing, and revel in game statistics. For us, it’s a passion that is replayed year after year with little to show for it other than memories and video replays. So we thought to ourselves, could we create a memento to a season that captures all the drama, struggles, and highlights? That’s what we set out to do.
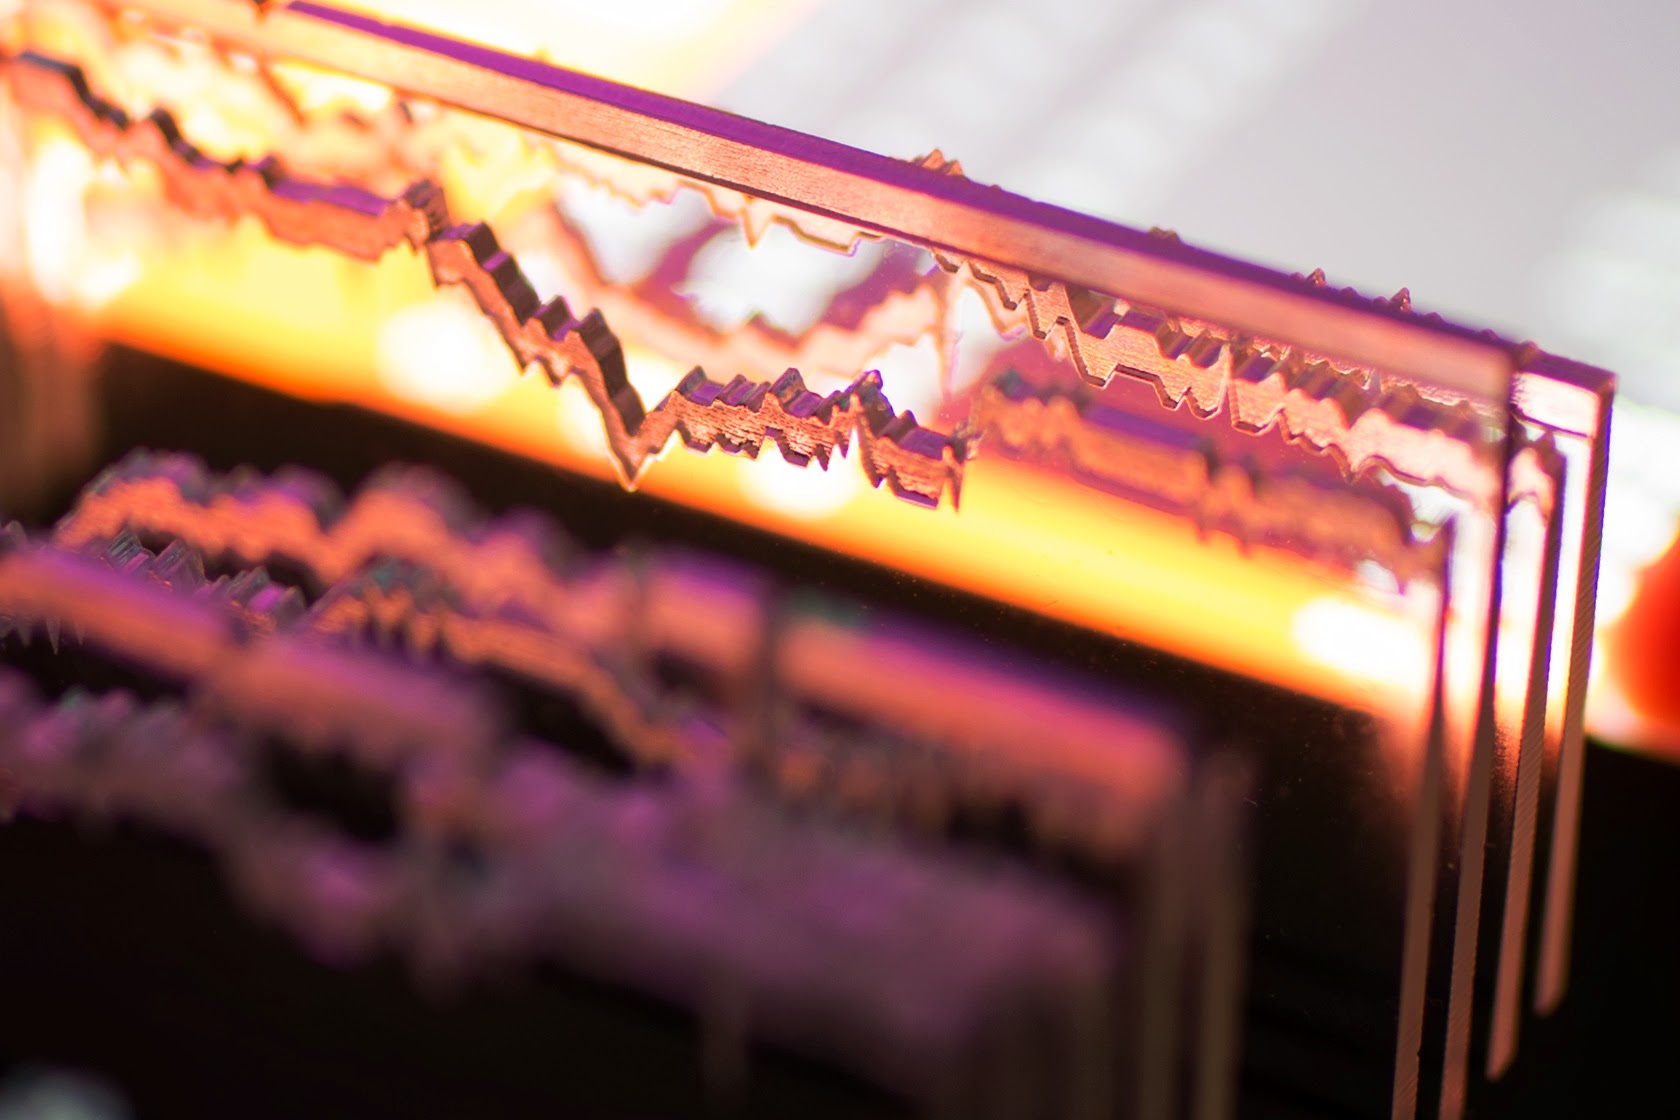
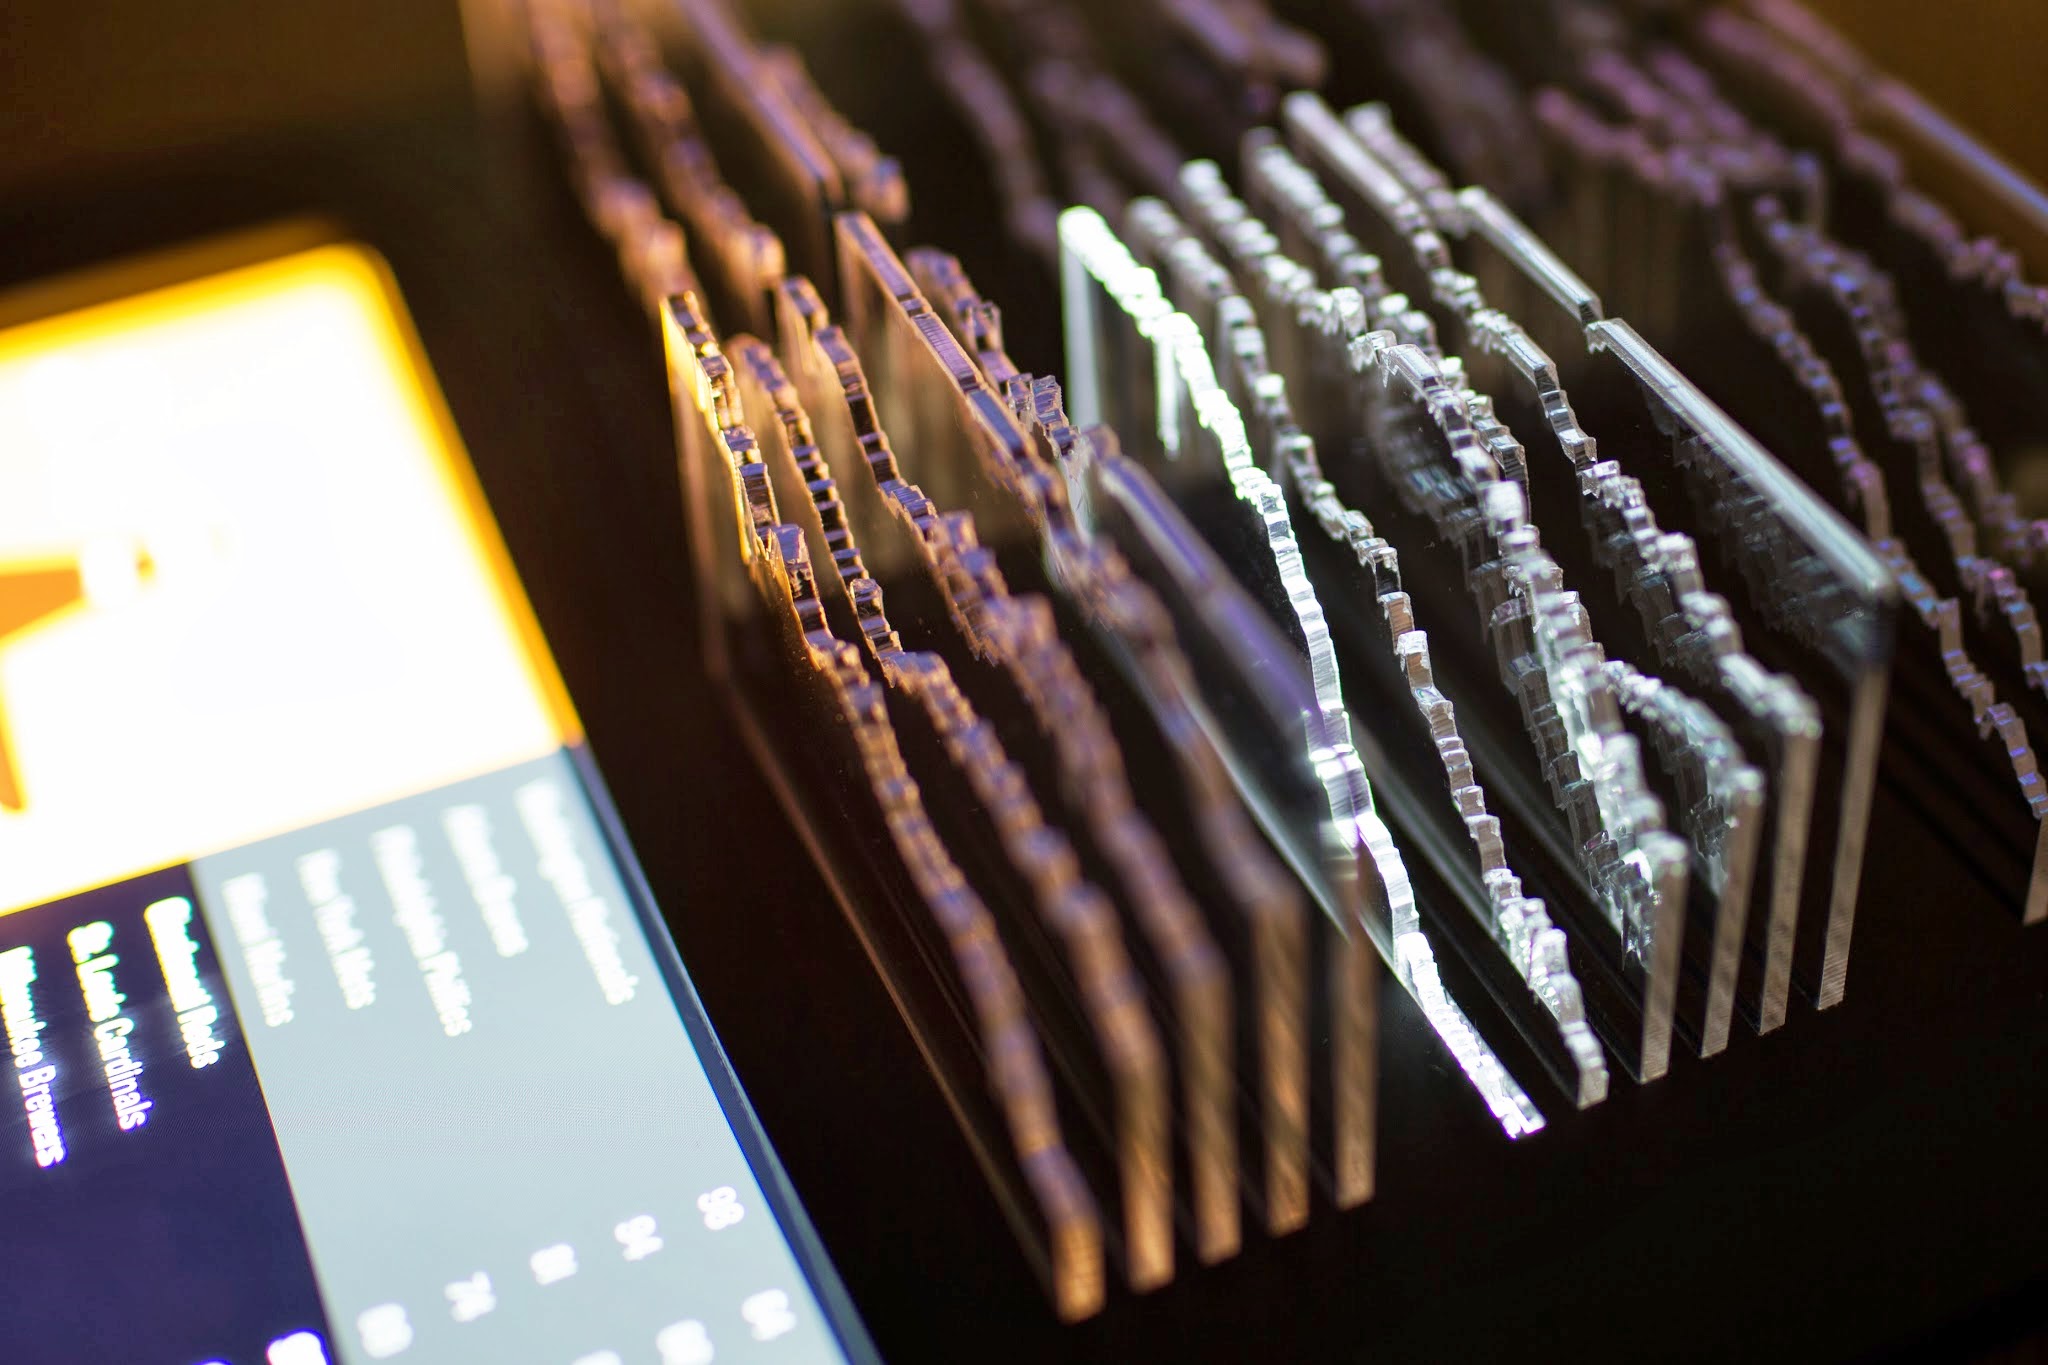
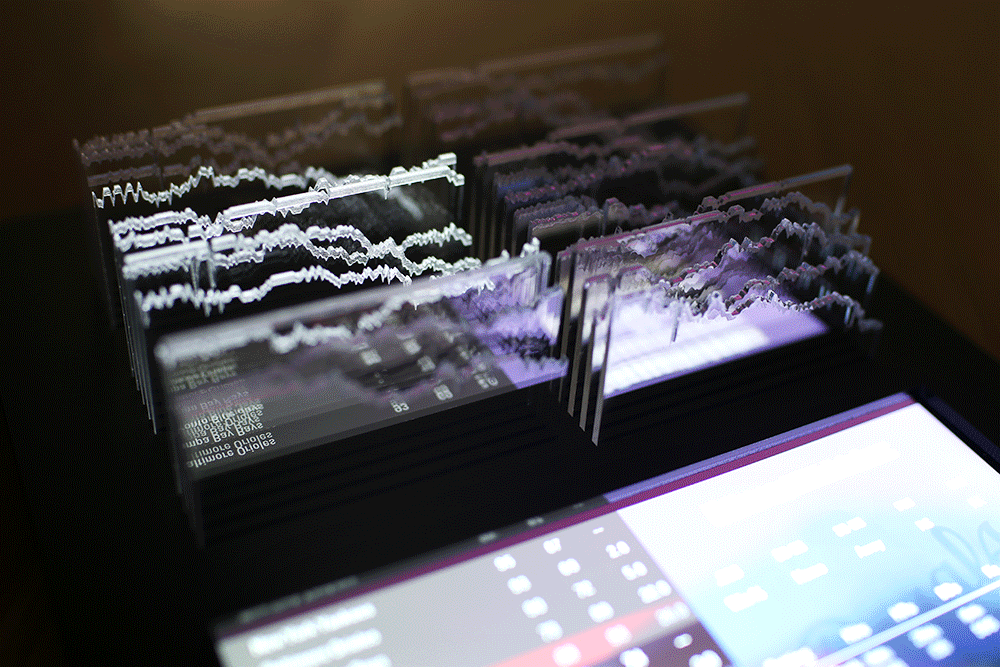
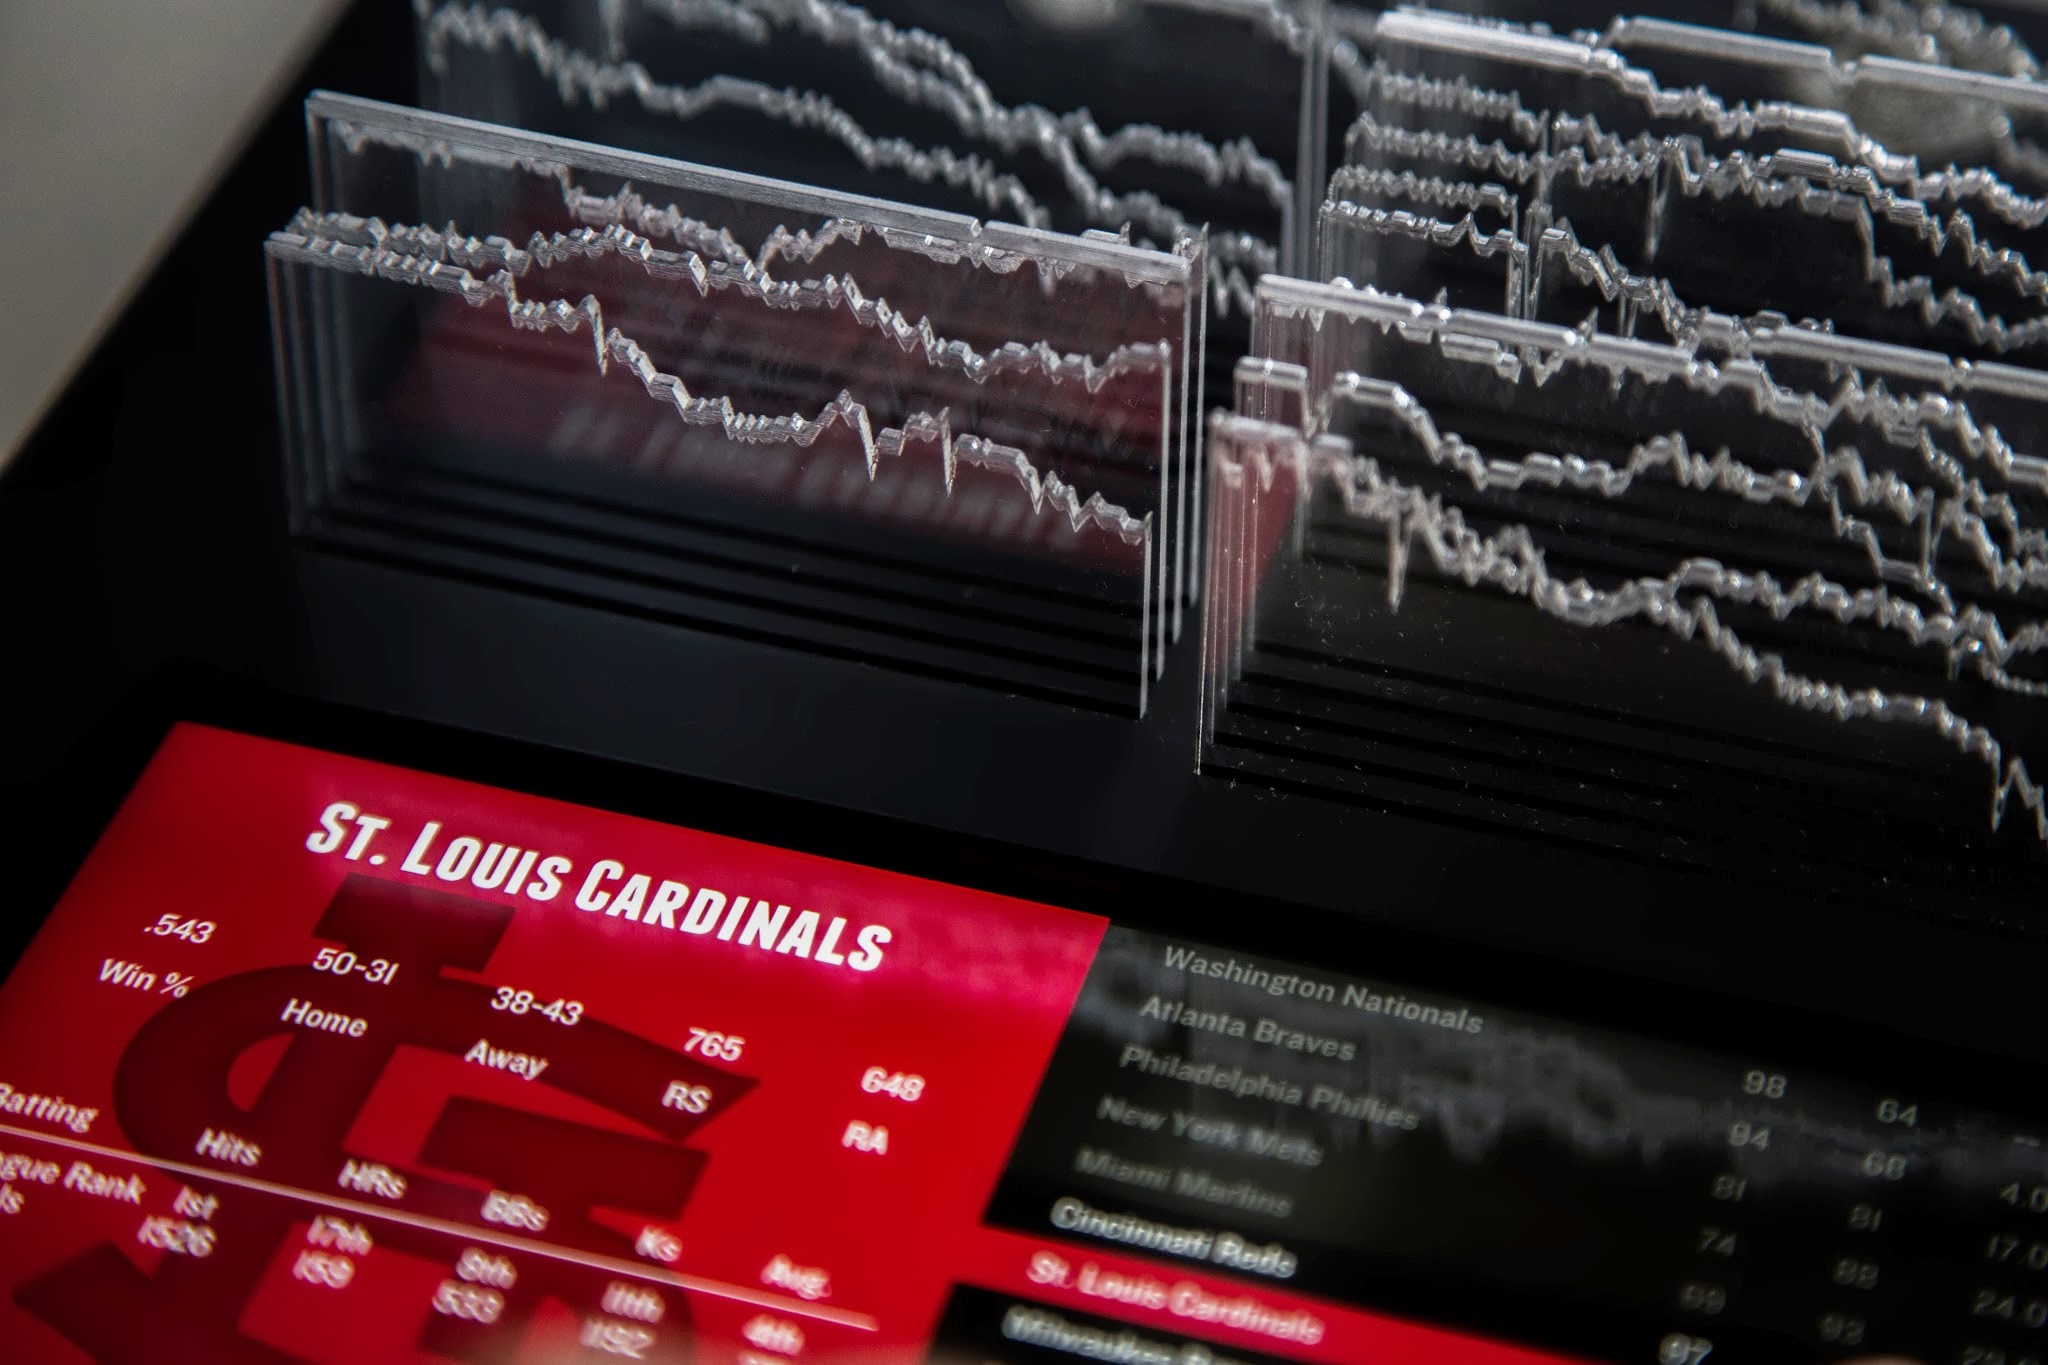
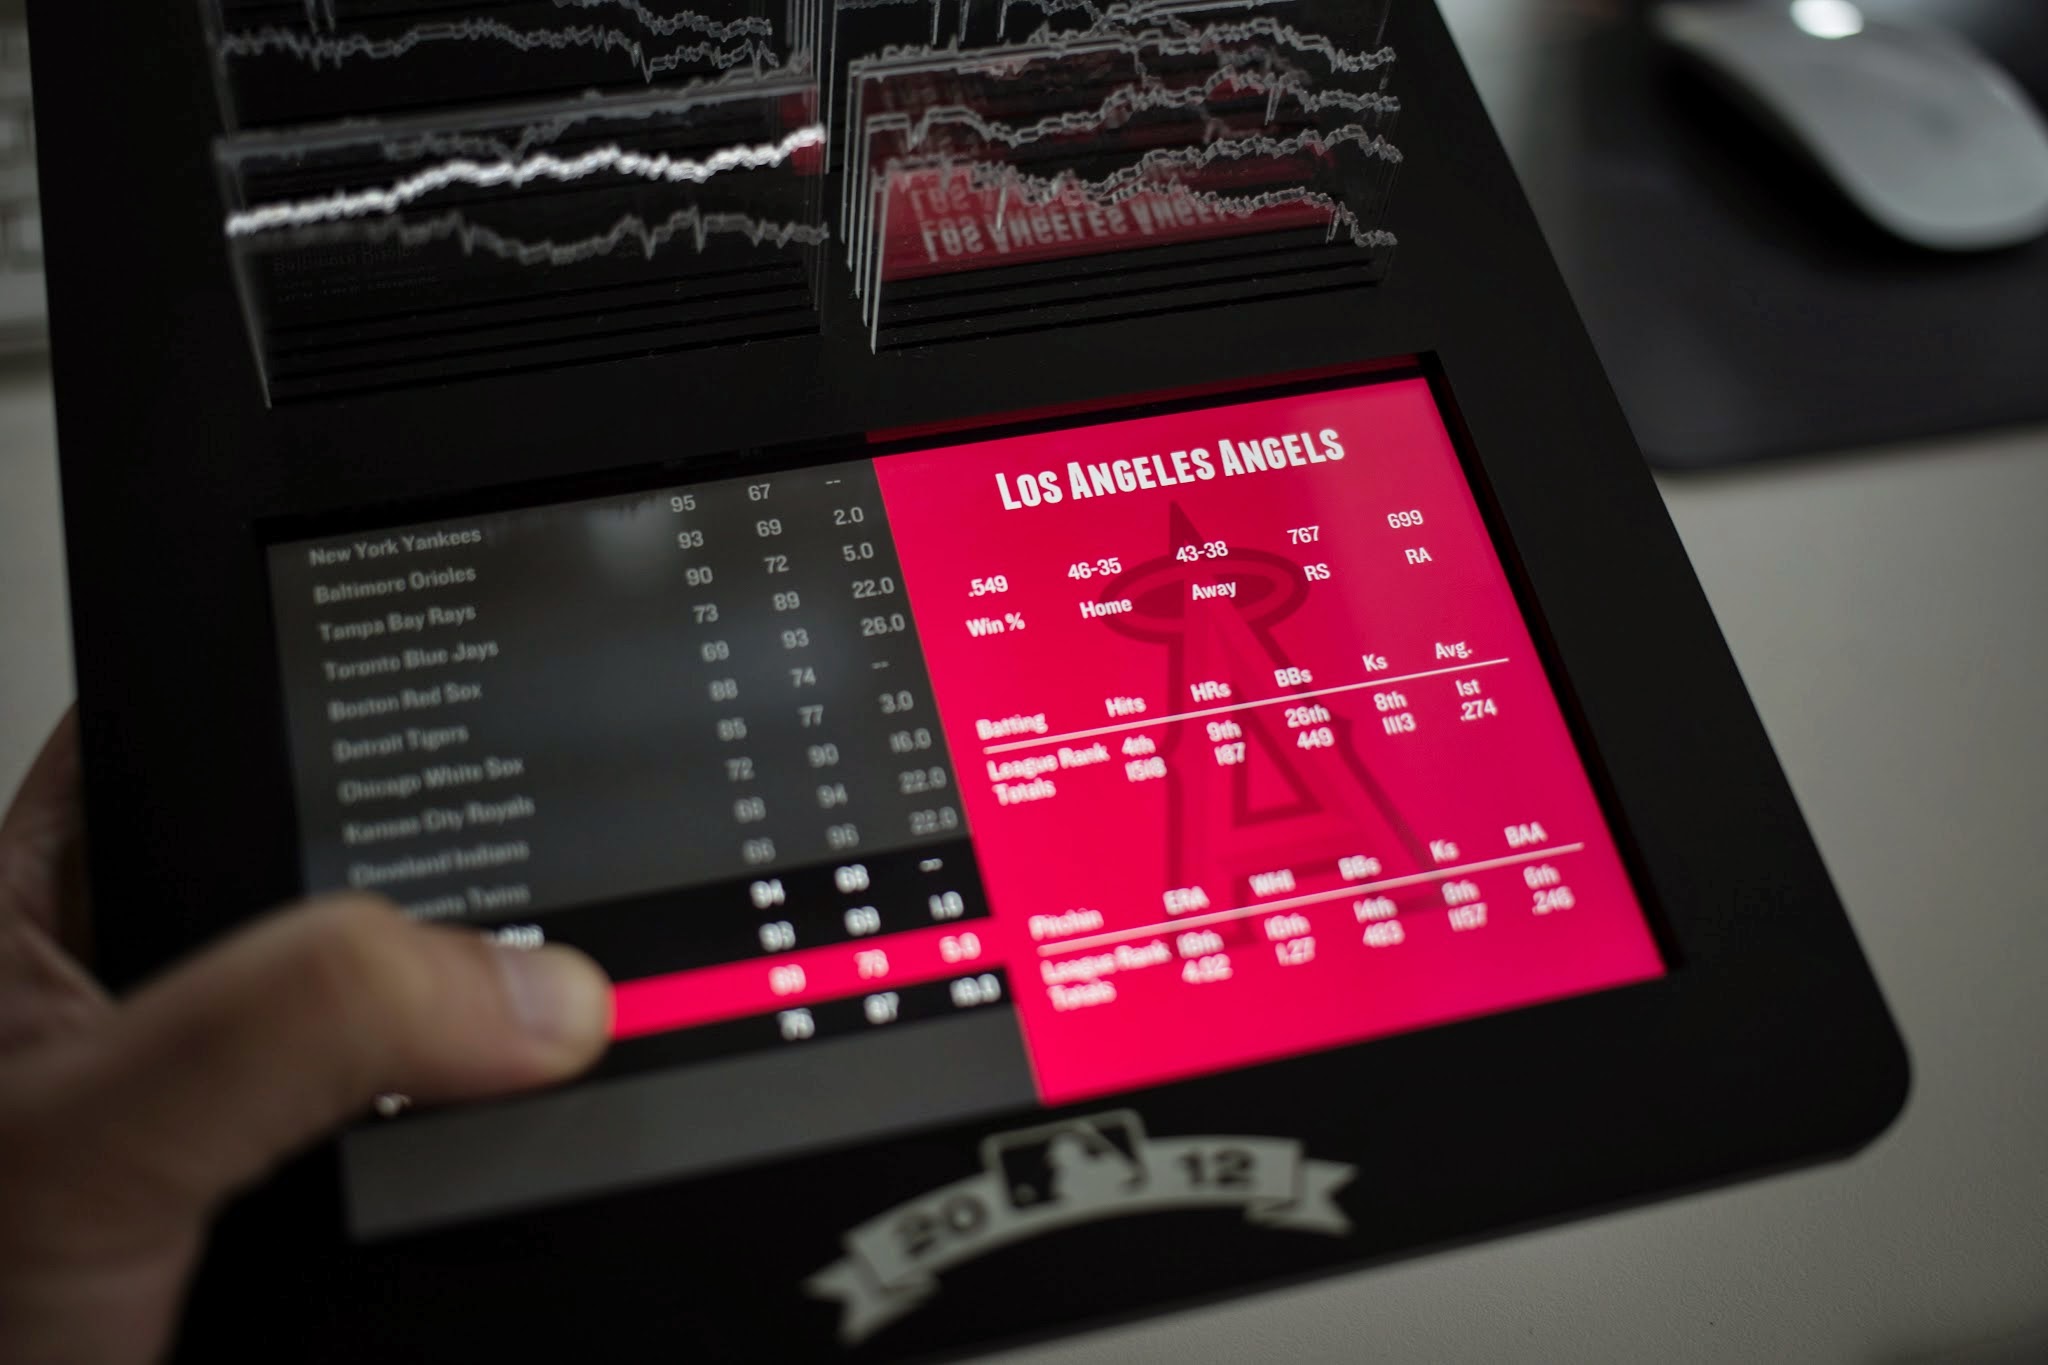
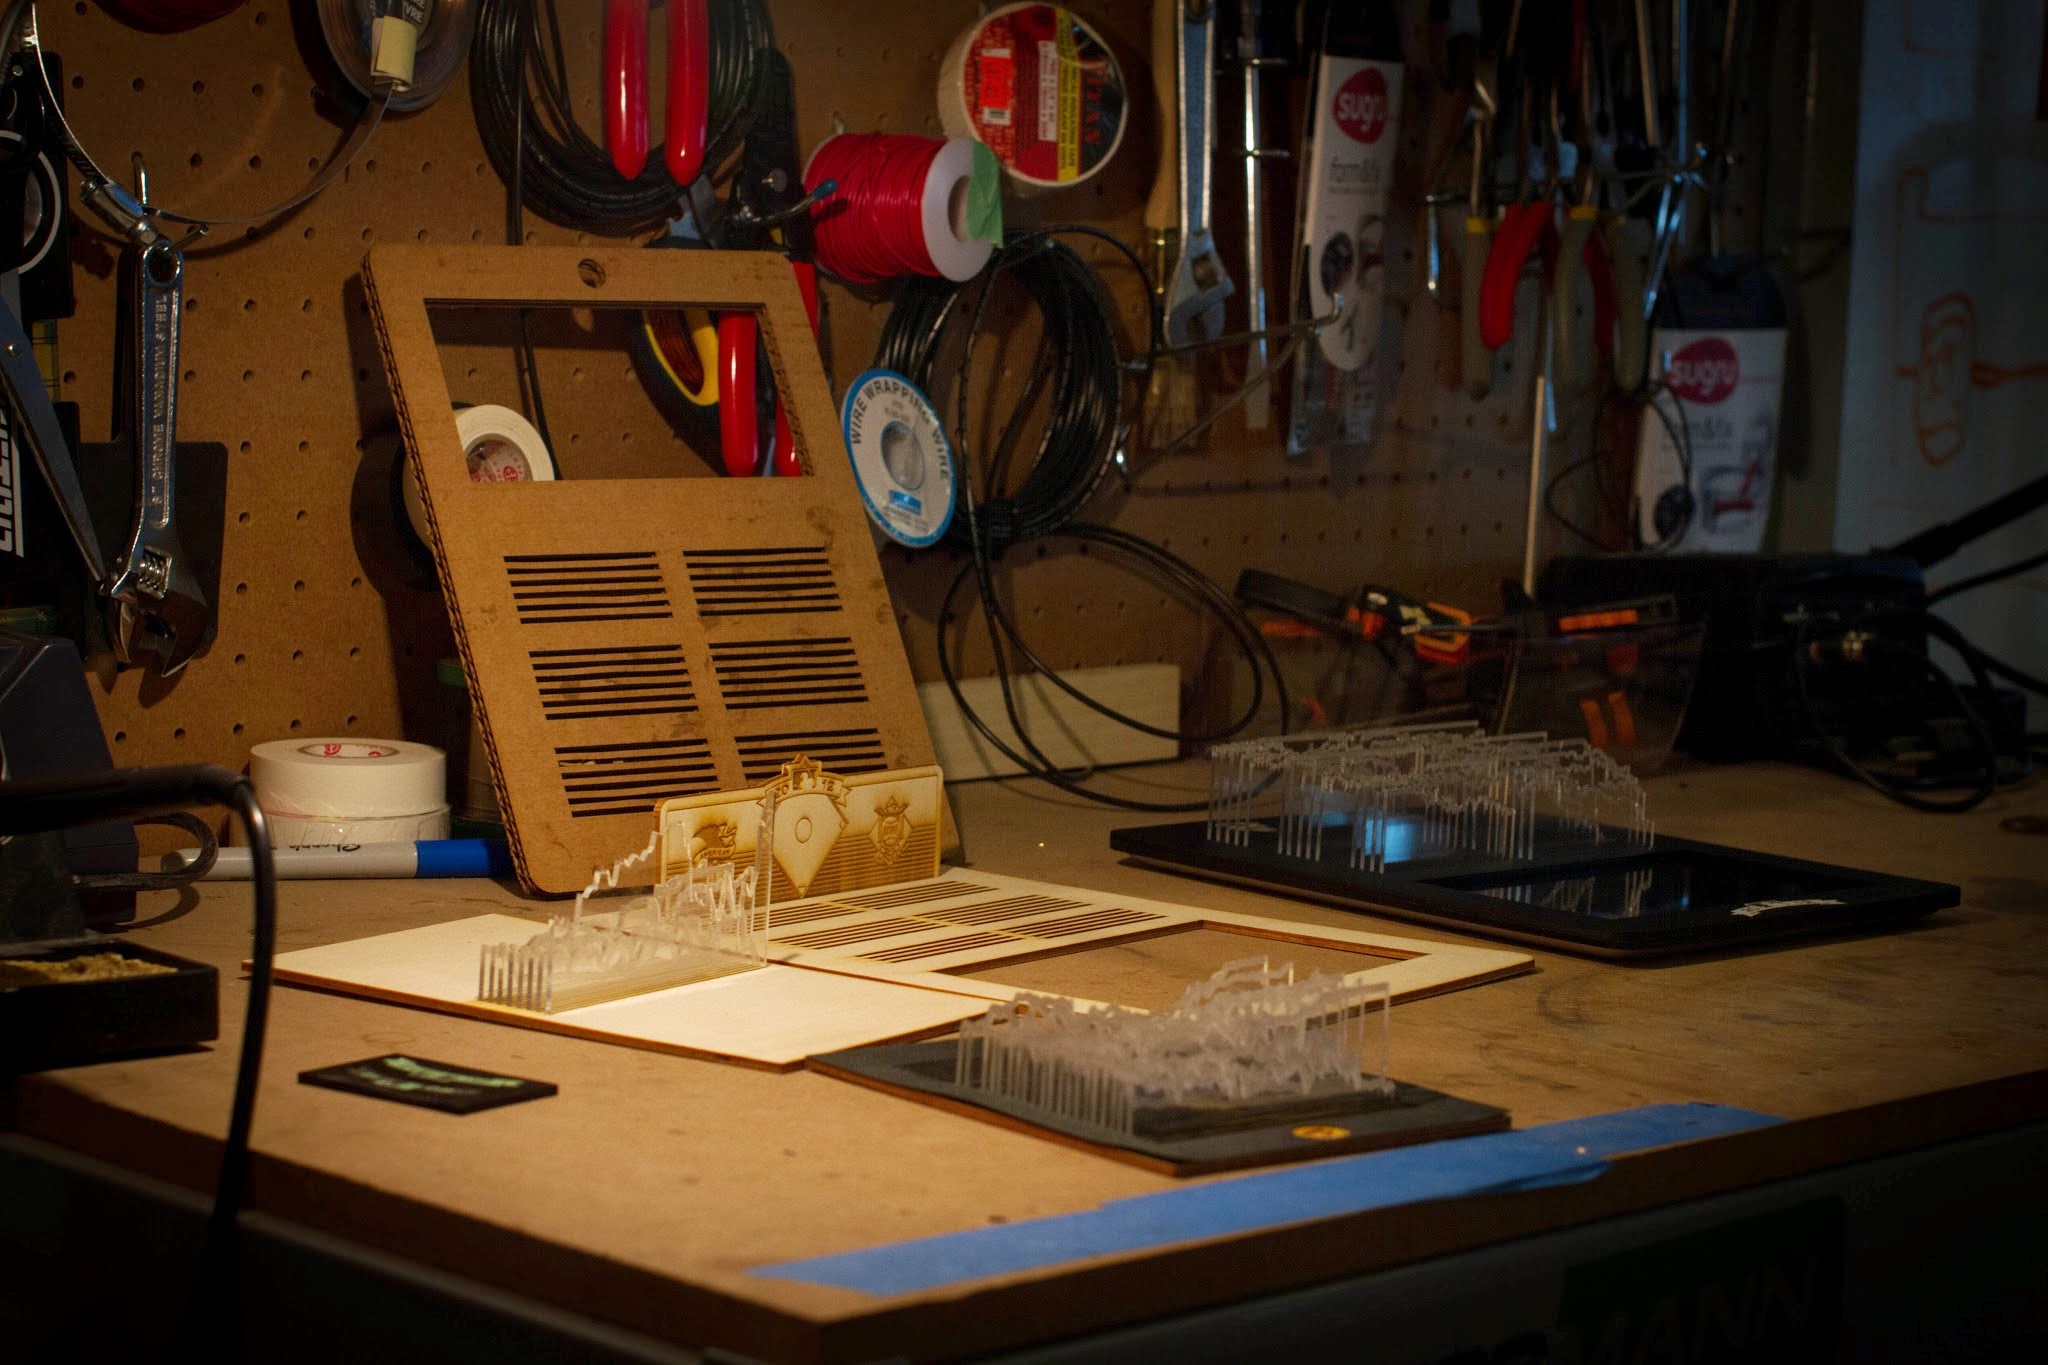
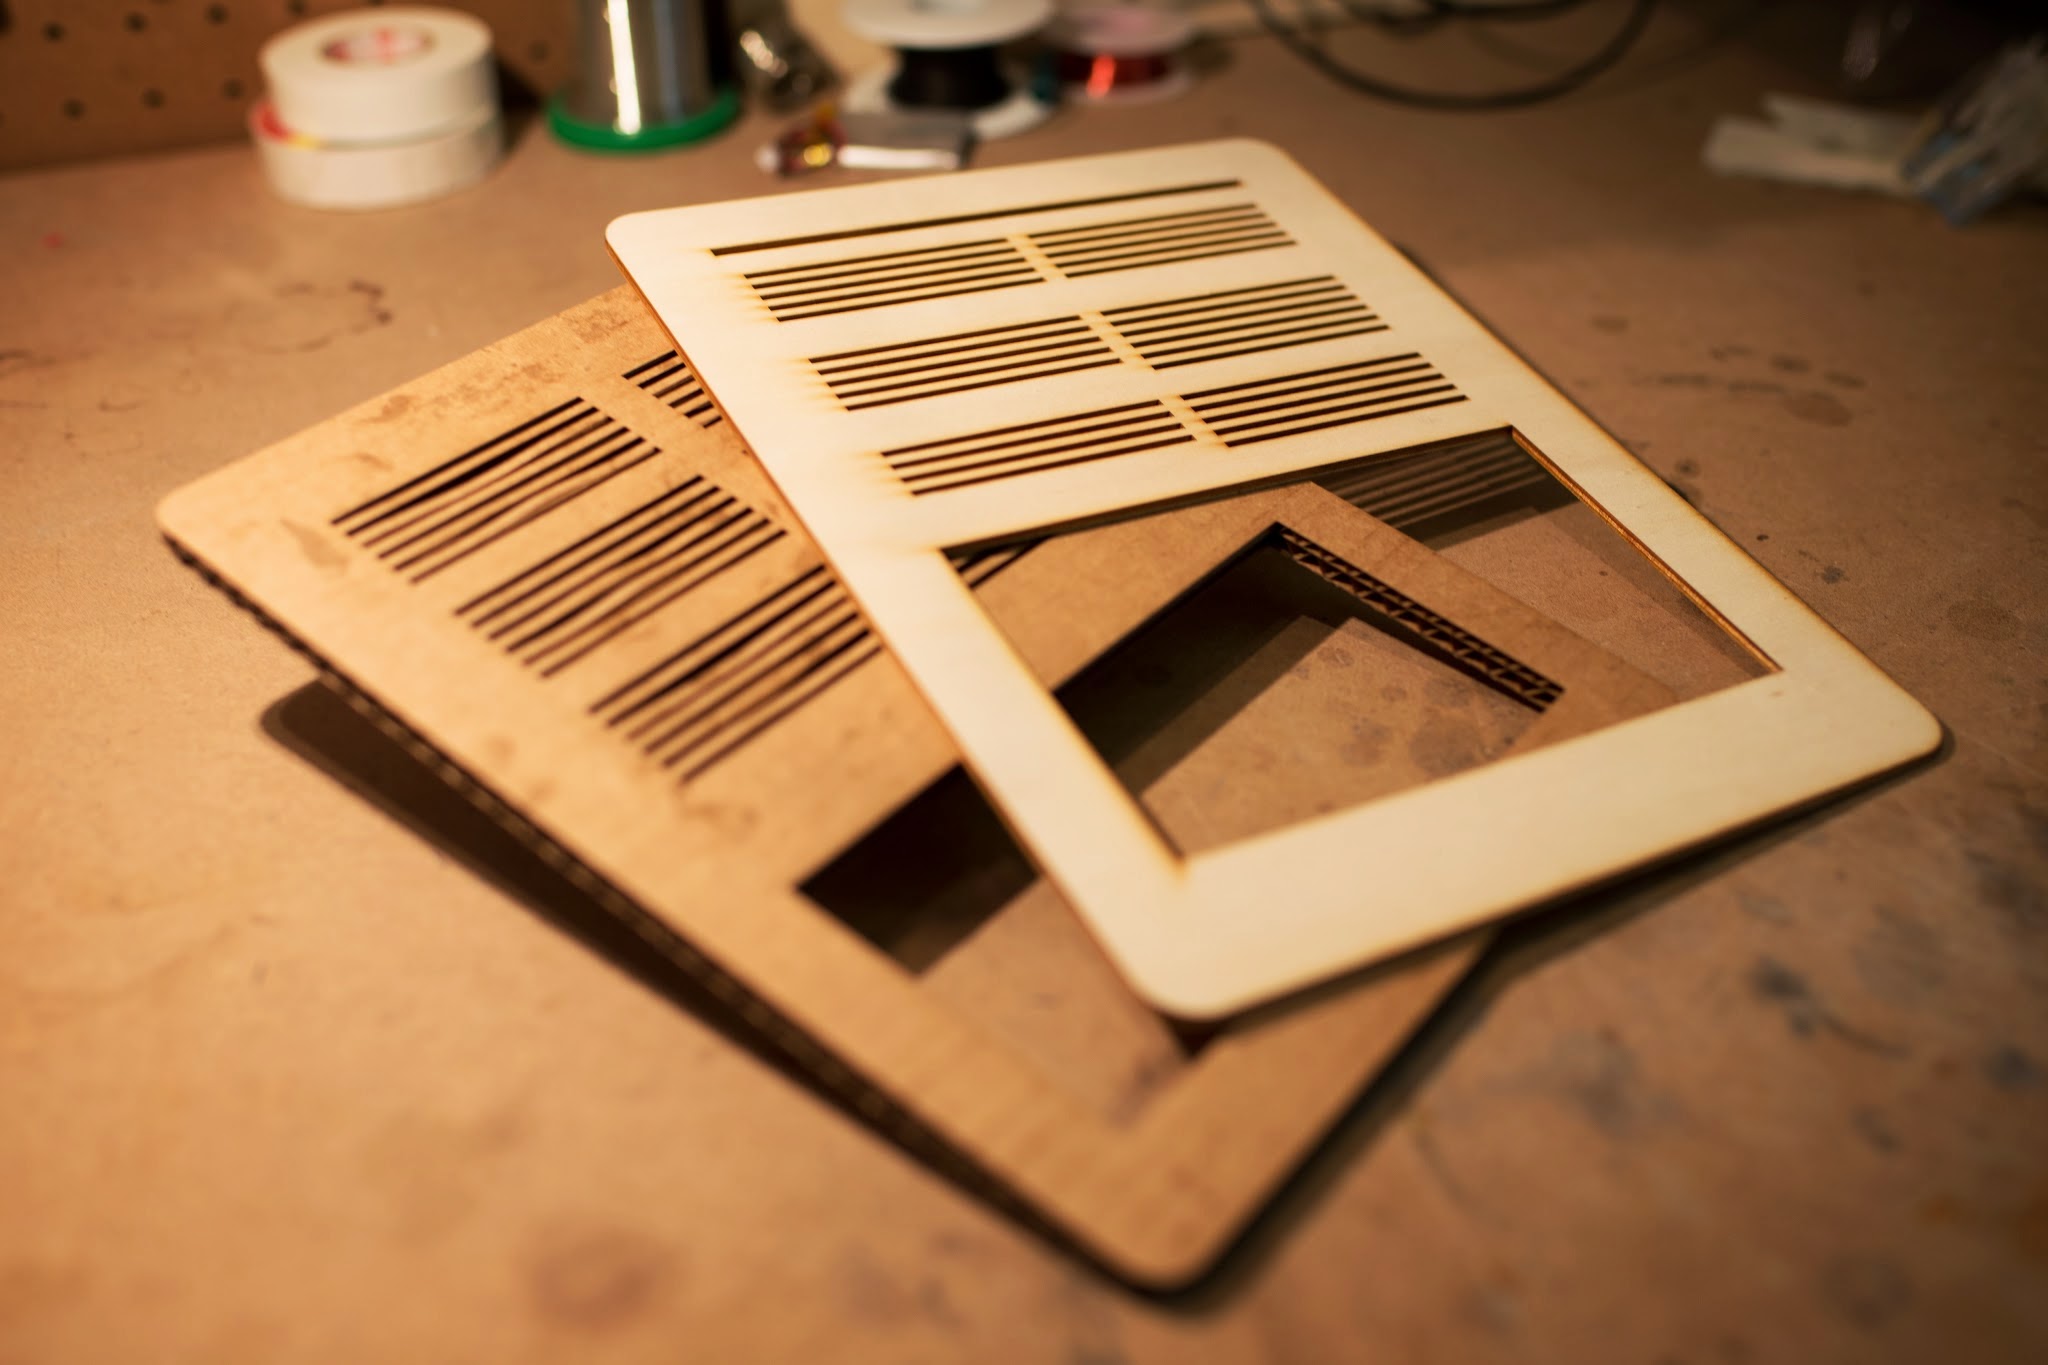
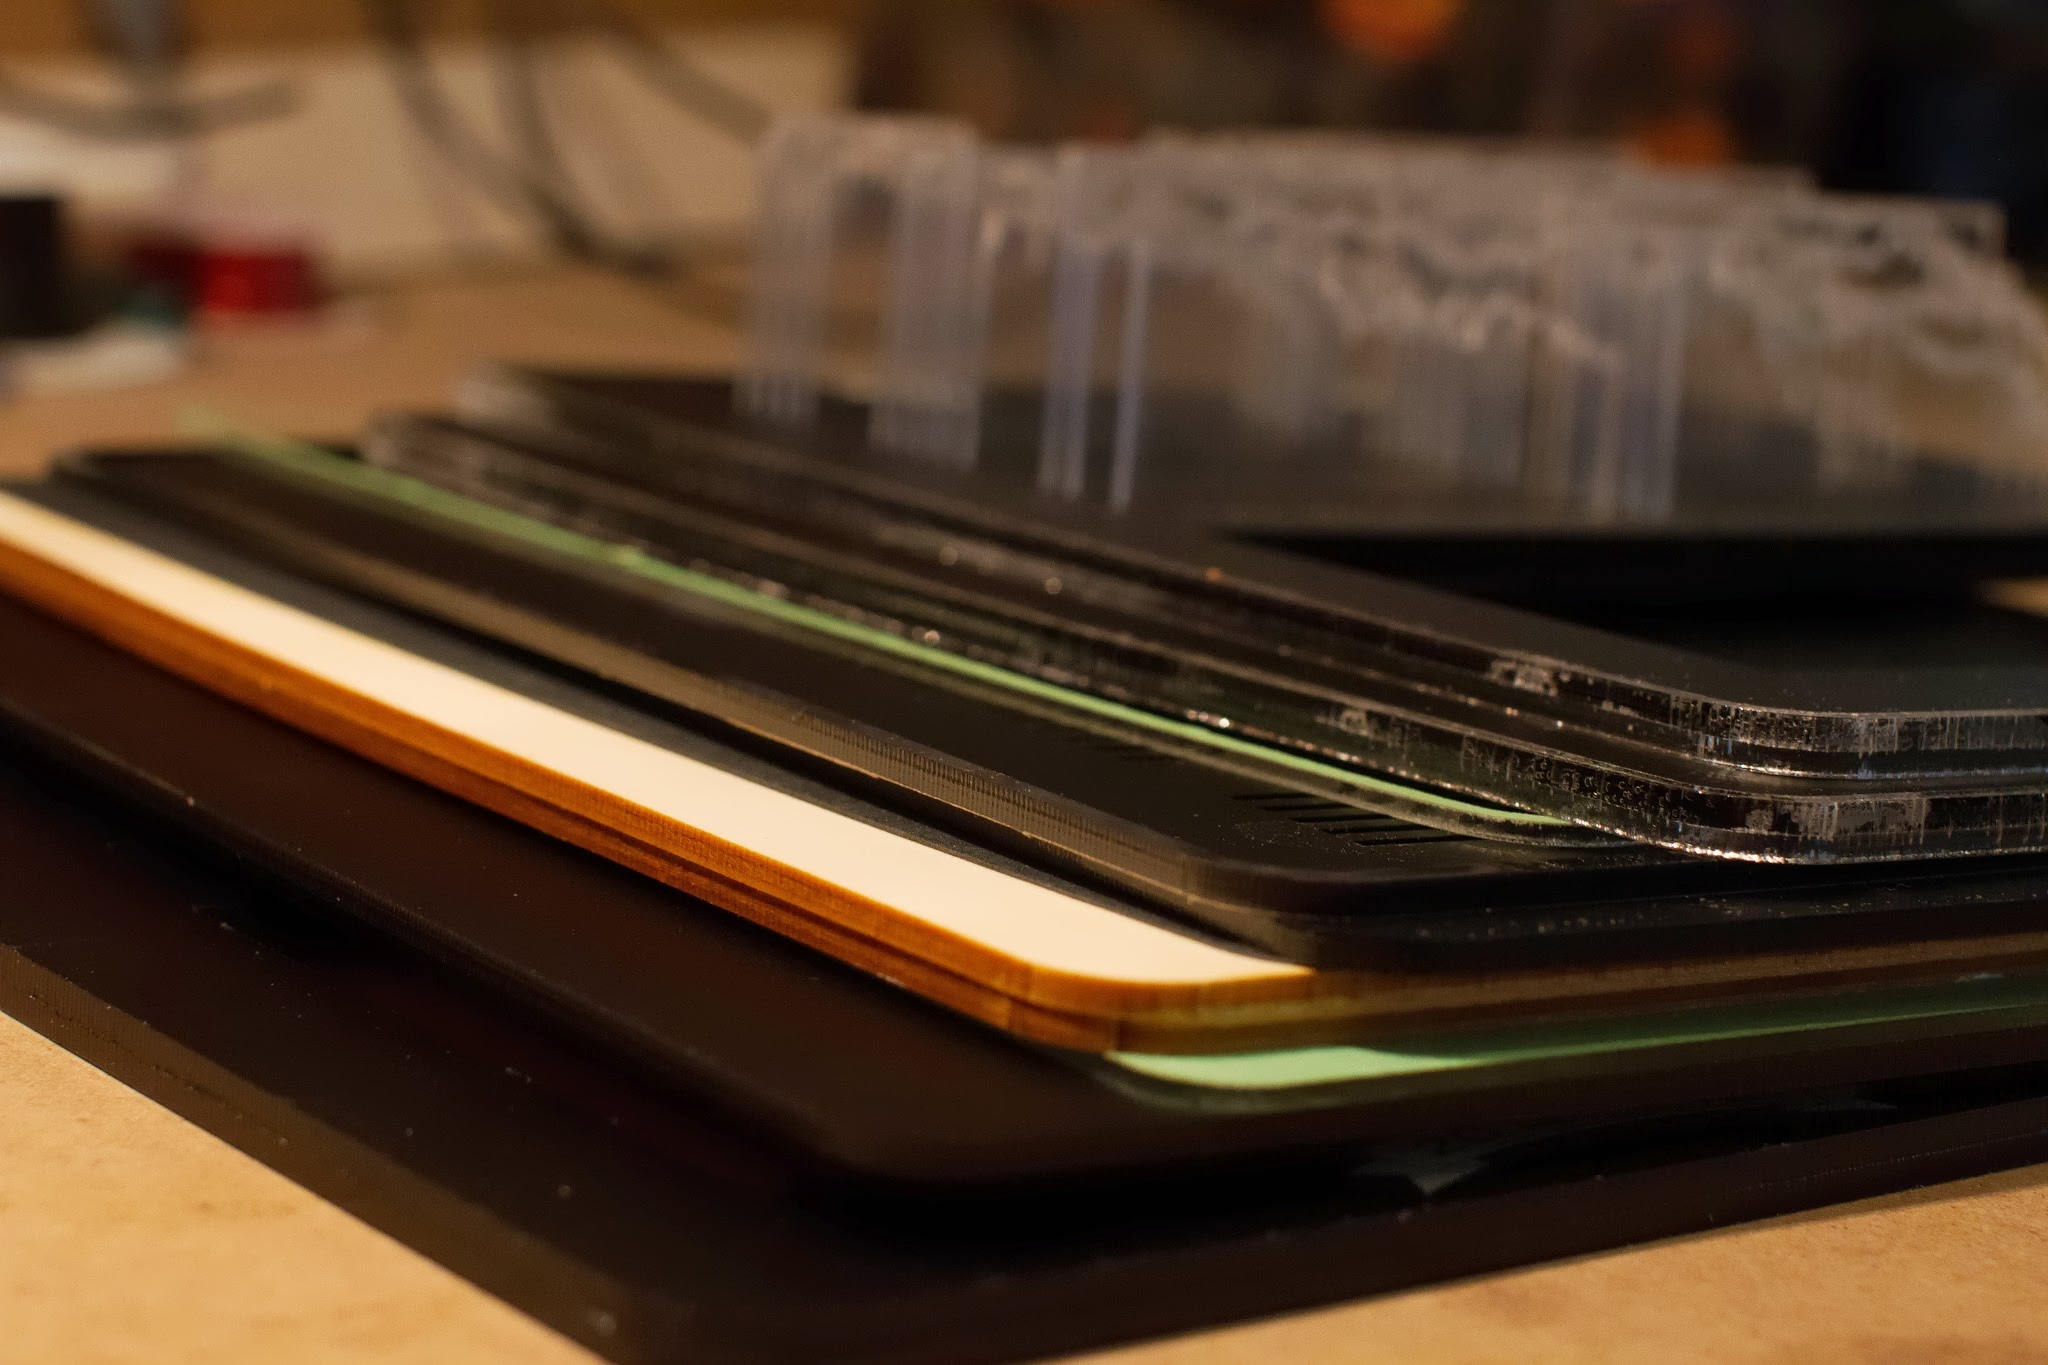
They used MLB Gameday data and wrote a script that pulled down daily snapshots from the 2012 season and logged games back per team over time. The script also generated a PDF with a graph per team that they could easily send to the laser cutter. In order to make the graphs more engaging and meaningful, they decided to add interactivity by edge lighting clear acrylic directly from the iPad. The tablet is used as a light source, control panel, and provides supplemental information. The base of our sculpture is the iPad with case cover with a window to an interactive surface.
How could we organize the slides in a way that was elegant and could still be viewed all at once? We started to experiment with cutting and stacking the graphs in a clear acrylic plastic. It was a technique we learned during a different Labs project that involved reimagining 3D displays. The stacked graphs helped organize teams into leagues/divisions and also let the user focus on a single team while looking through the others. When fit upright on an opaque base, the overall structure not only conveyed information better, but the dozens of closely arranged seemingly-glass slides looked stunning. This was exactly the effect we were going for.
Read more about the project at the link below.
Project Page | Teehan+Lax Labs