
Well-Formed Eigenfactor
The Eigenfactor score of a journal is an estimate of the percentage of time that library users spend with that journal. The Eigenfactor algorithm corresponds to a simple model of research in which readers follow chains of citations as they move from journal to journal. Imagine that a researcher goes to the library and selects a journal article at random. After reading the article, the researcher selects at random one of the citations from the article. She then proceeds to the journal that was cited, reads a random article there, and selects a citation to direct her to her next journal volume. The researcher does this ad infinitum.
Included in the project are four visualizations:
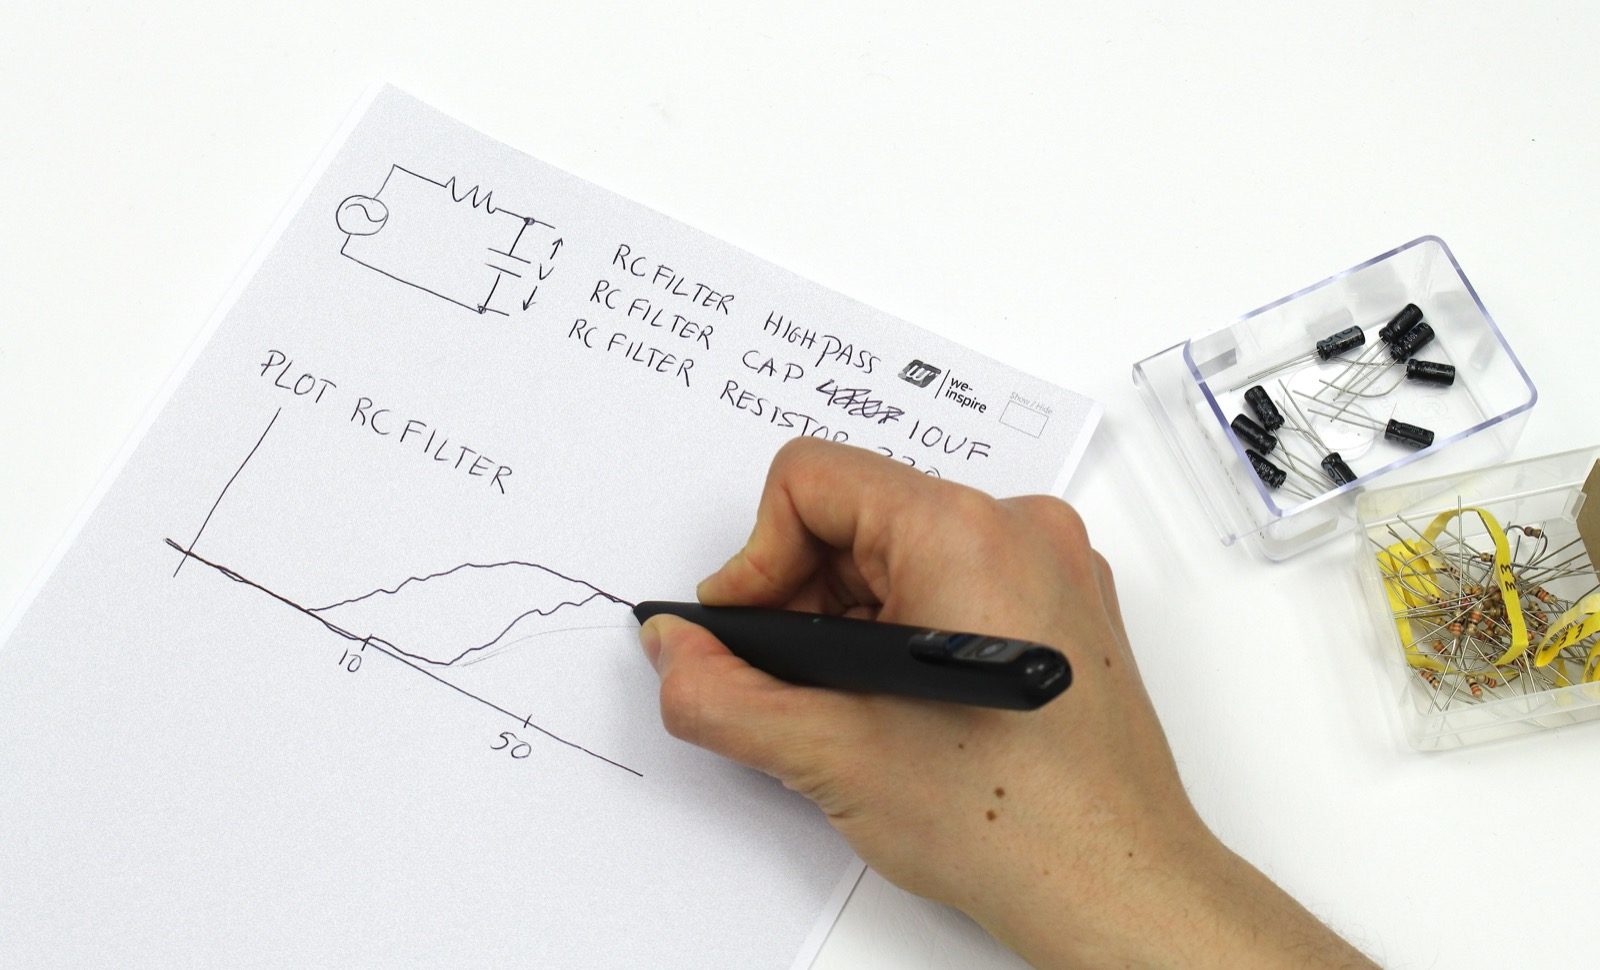
Citation Patterns
This visualization gives an overview of the whole citation network. The colors represent the four main groups of journals, which are further subdivided into fields in the outer ring. The segments of the inner ring represent the individual journals, scaled by Eigenfactorâ„¢ Score.


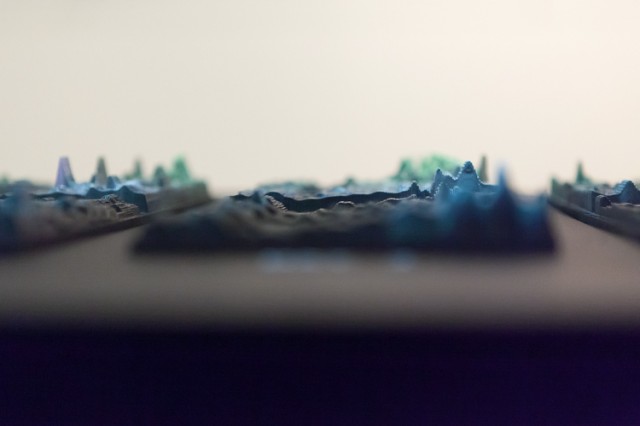
Change Over Time
Inspired by Sankey diagrams and stacked bar charts, this diagram displays changes in Eigenfactorâ„¢ Score and clustering over time. The columns corresponds to the years 1997, 1999, 2001, 2003 and 2005.


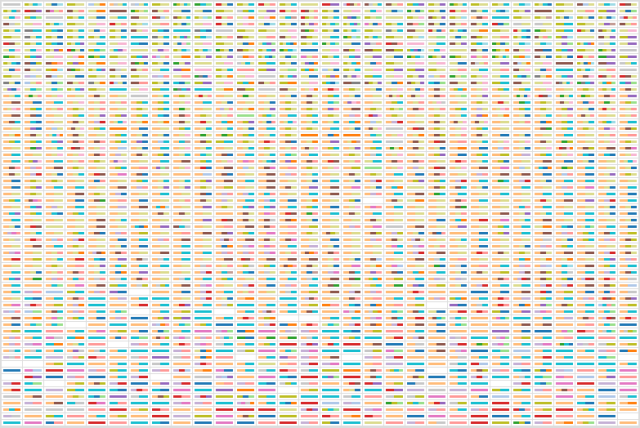
Clustering
This visualization displays a hierarchical clustering of journals in the form of a treemap. The size of a journal marker corresponds to its Eigenfactorâ„¢ Score.


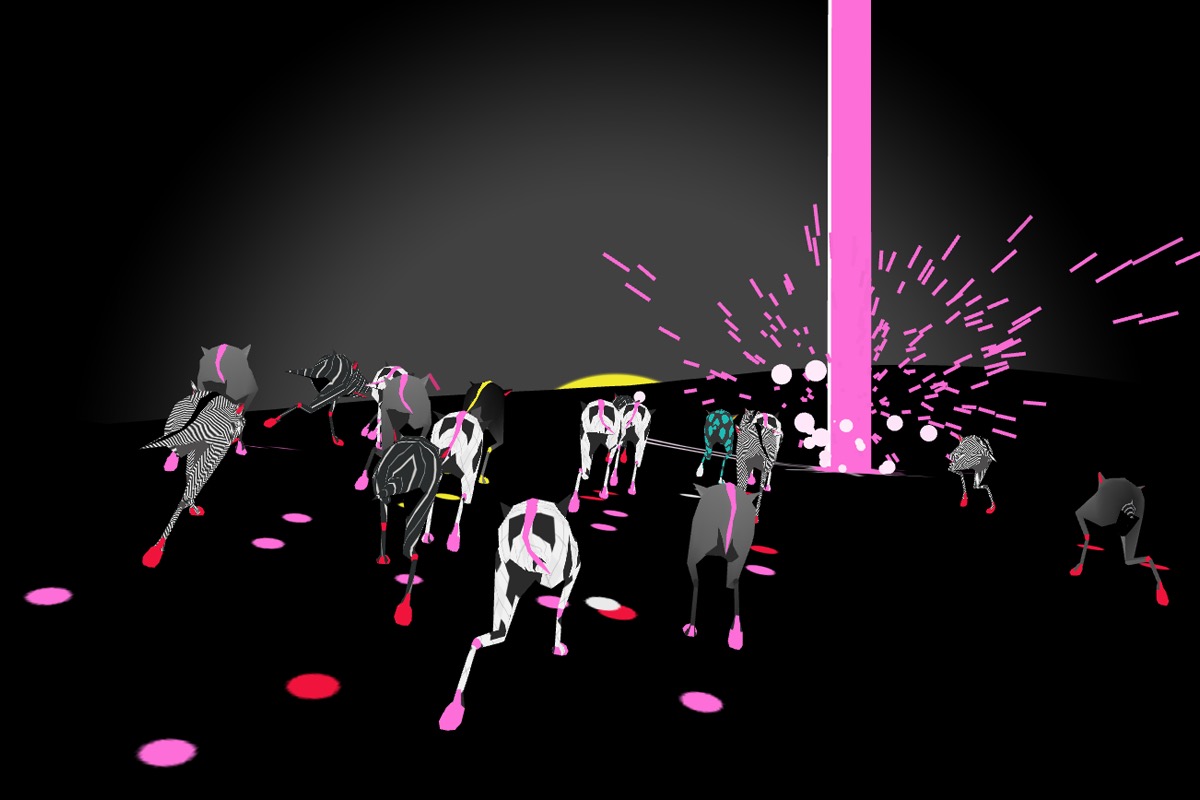
Map
This map visualization puts journals, which frequently cite each other, closer together. You can drag the white magnification lens around to enlarge a part of the map for closer inspection.


You can find more information on the project, explore and a more detailed description of each of the visualizations on the project’s website here.
Platform: Flash
Version: N/A
Developer/Designer:Â Moritz Stefaner
Visit Project