Can we experience data on our city’s affordability crisis, block by block, in immediate, somatic ways?
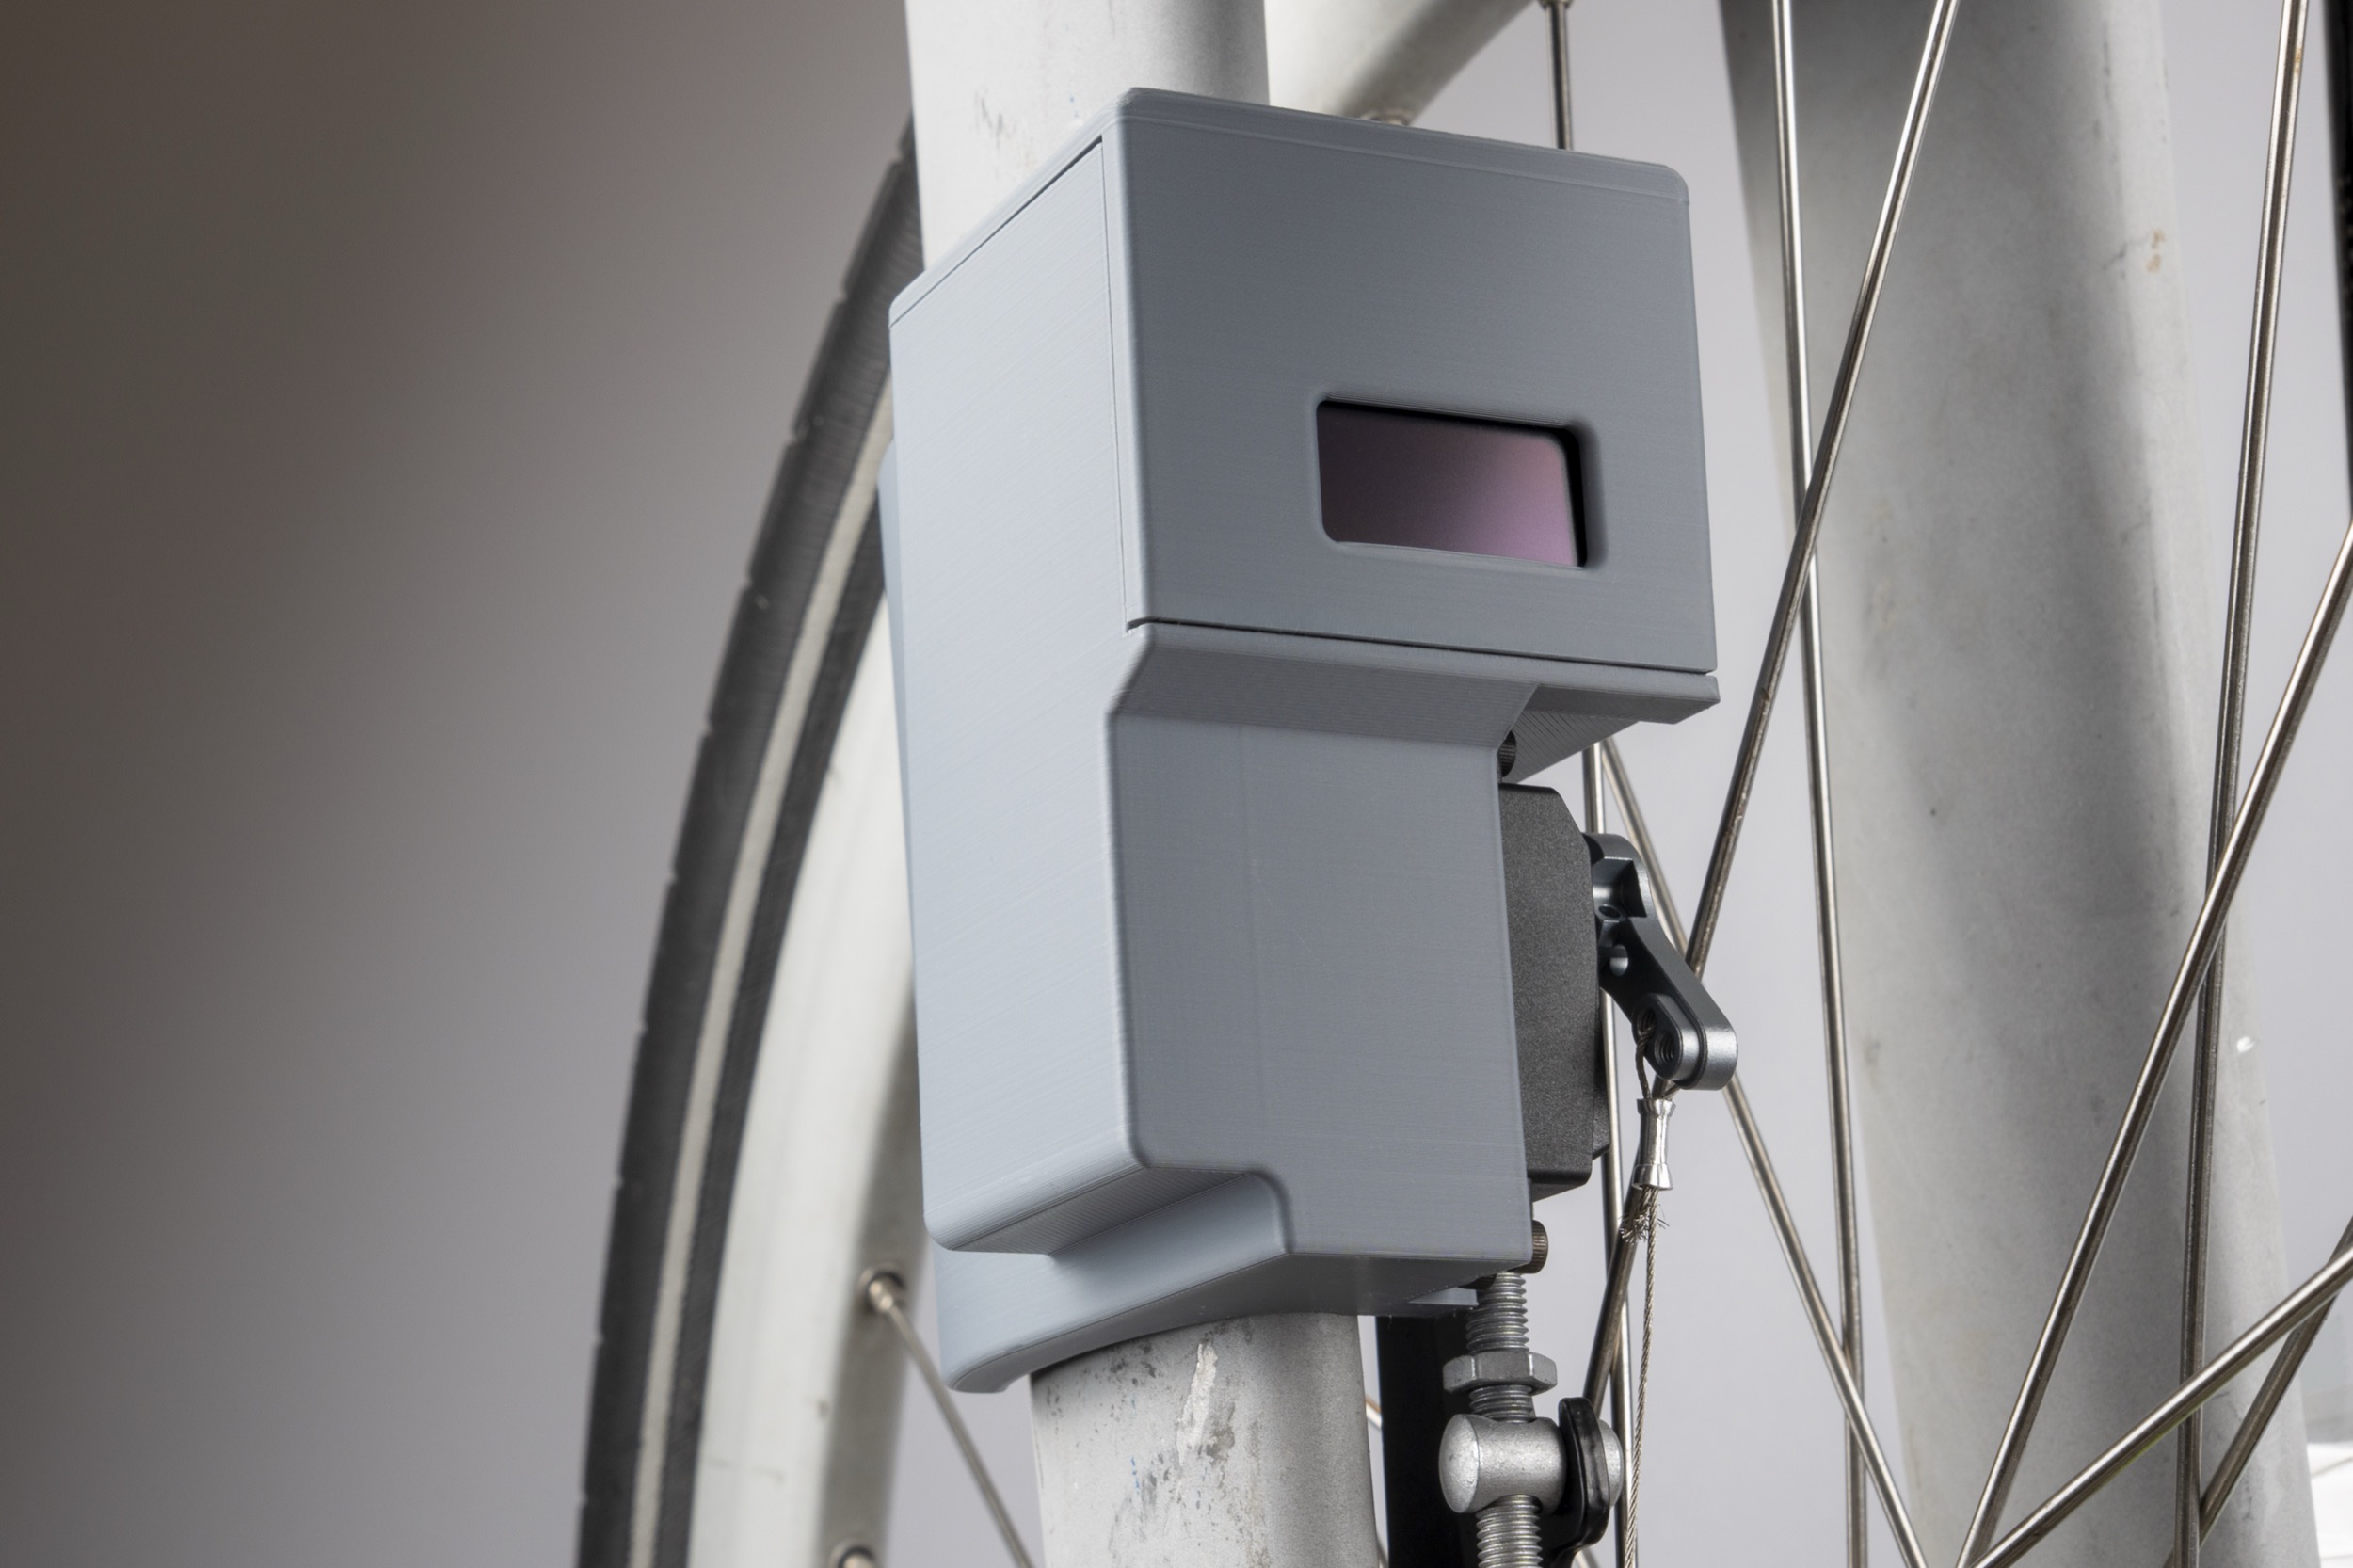
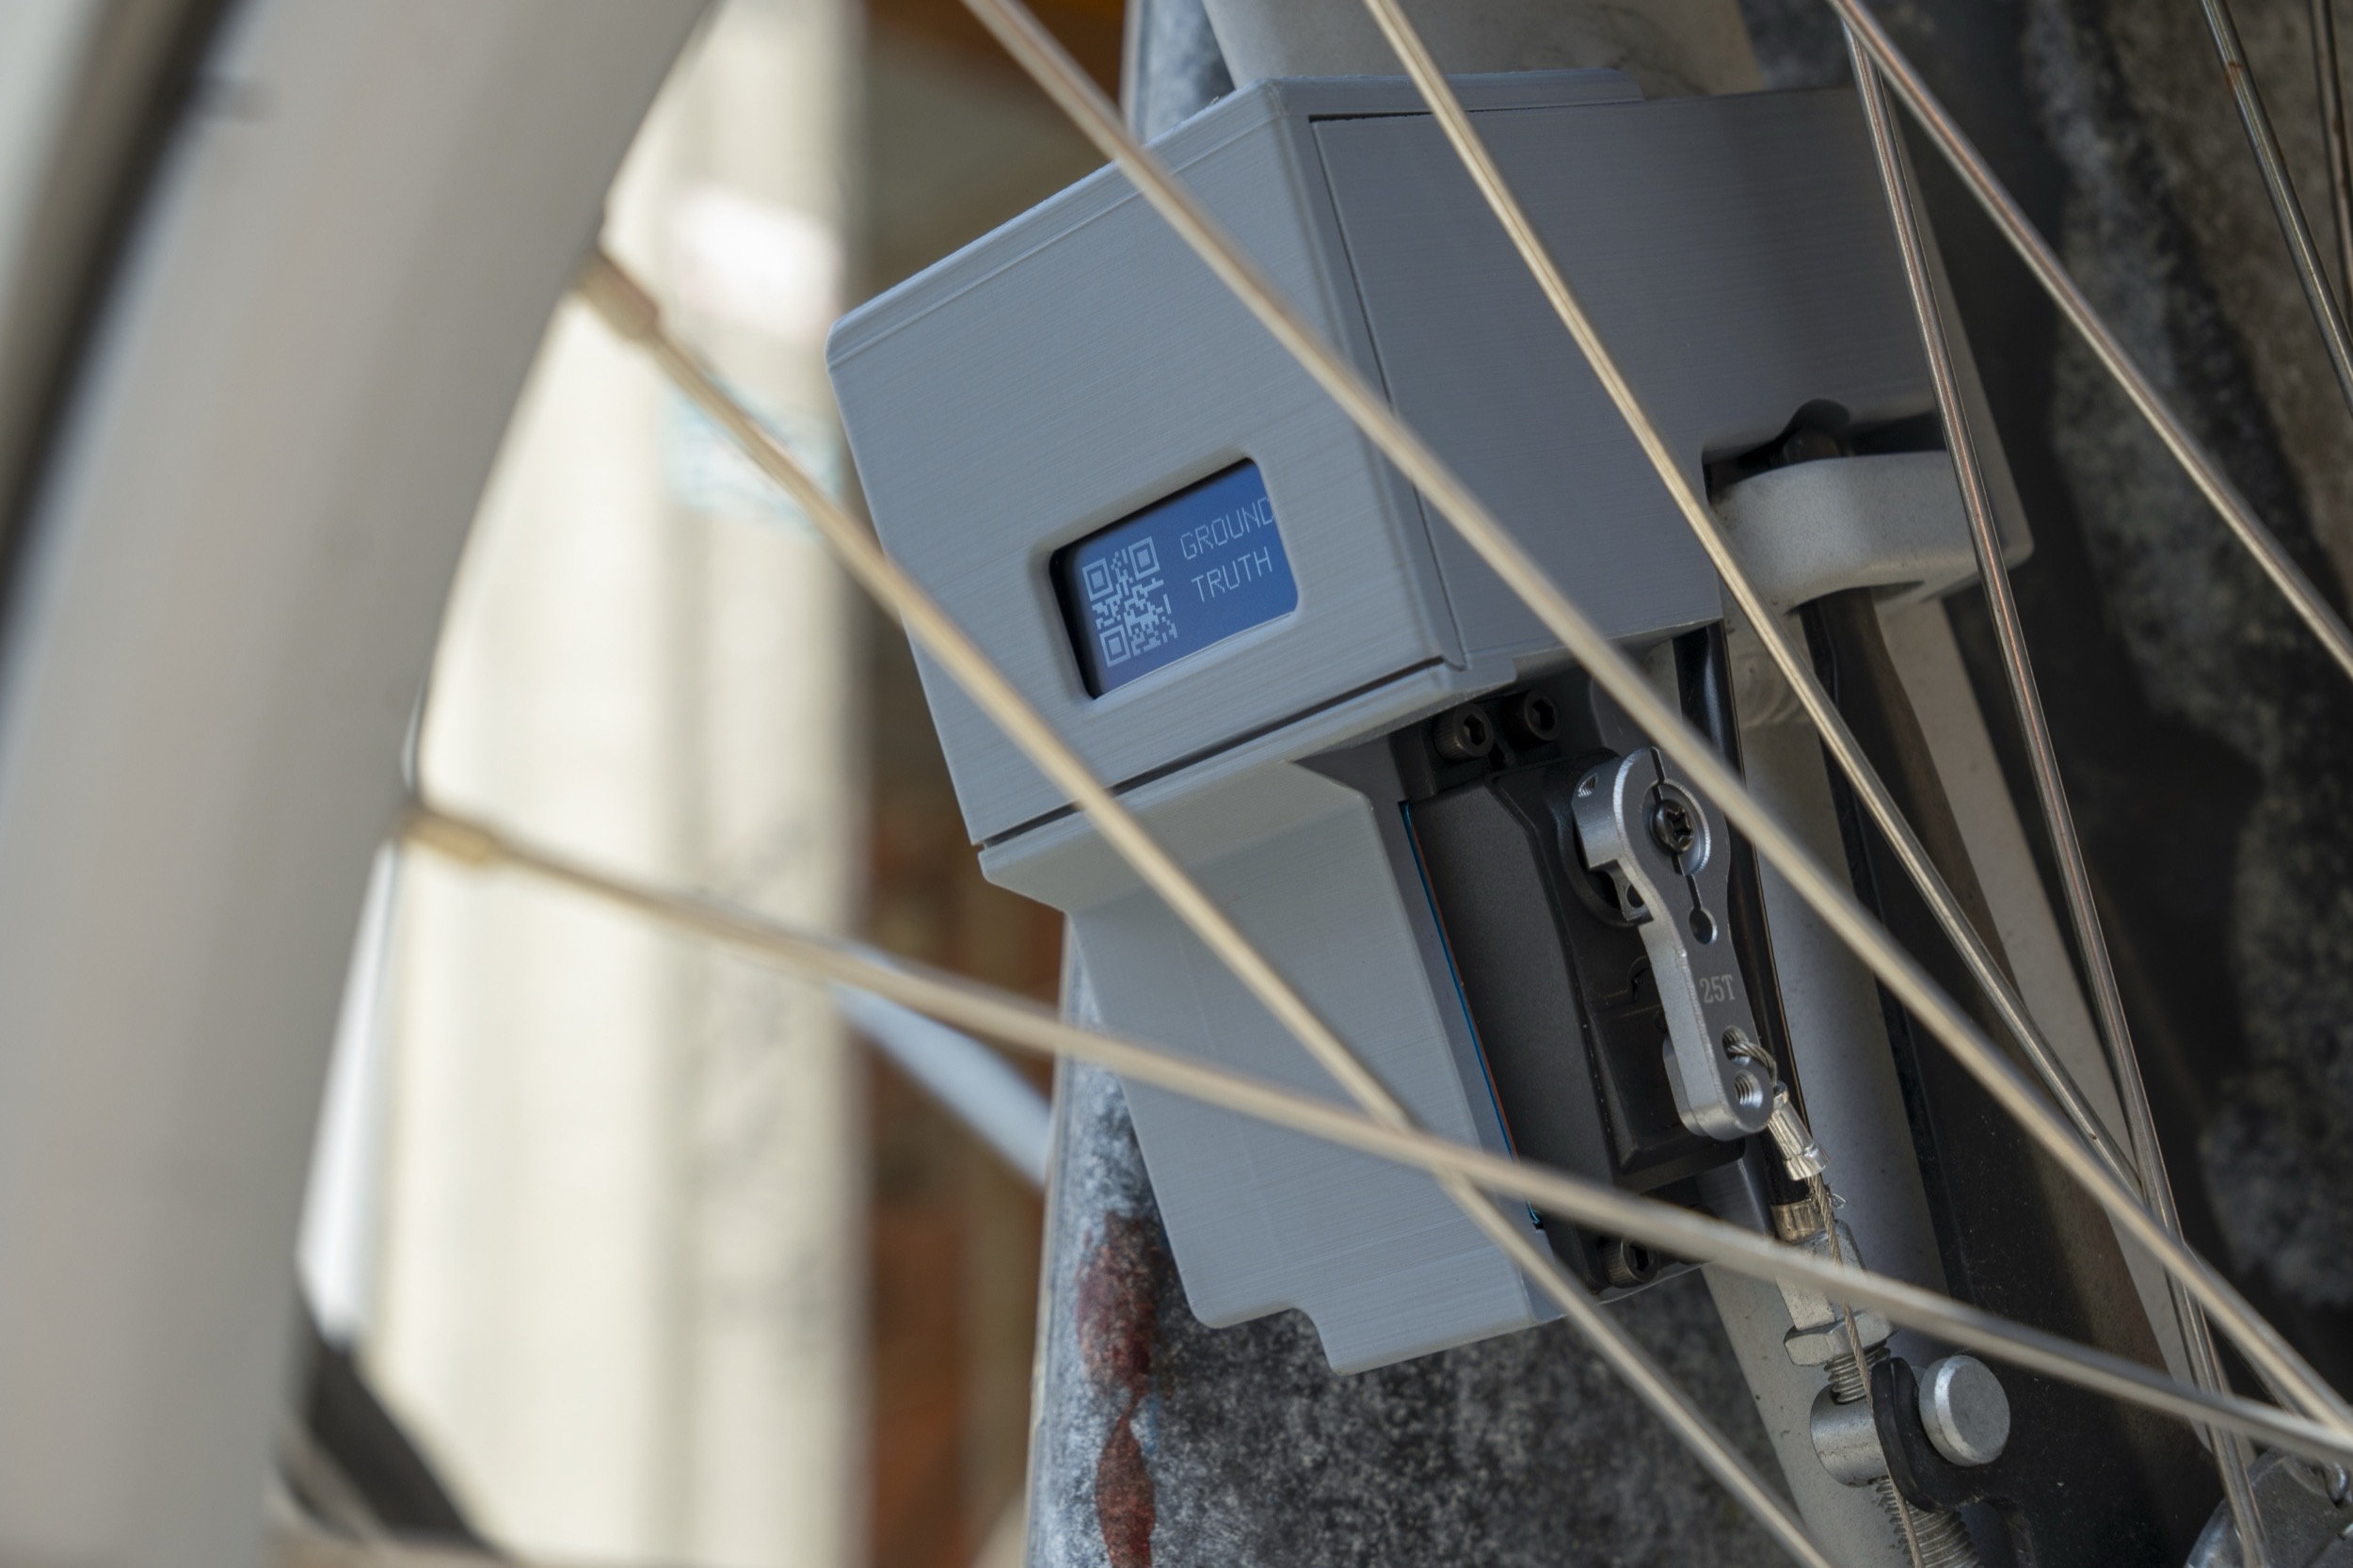
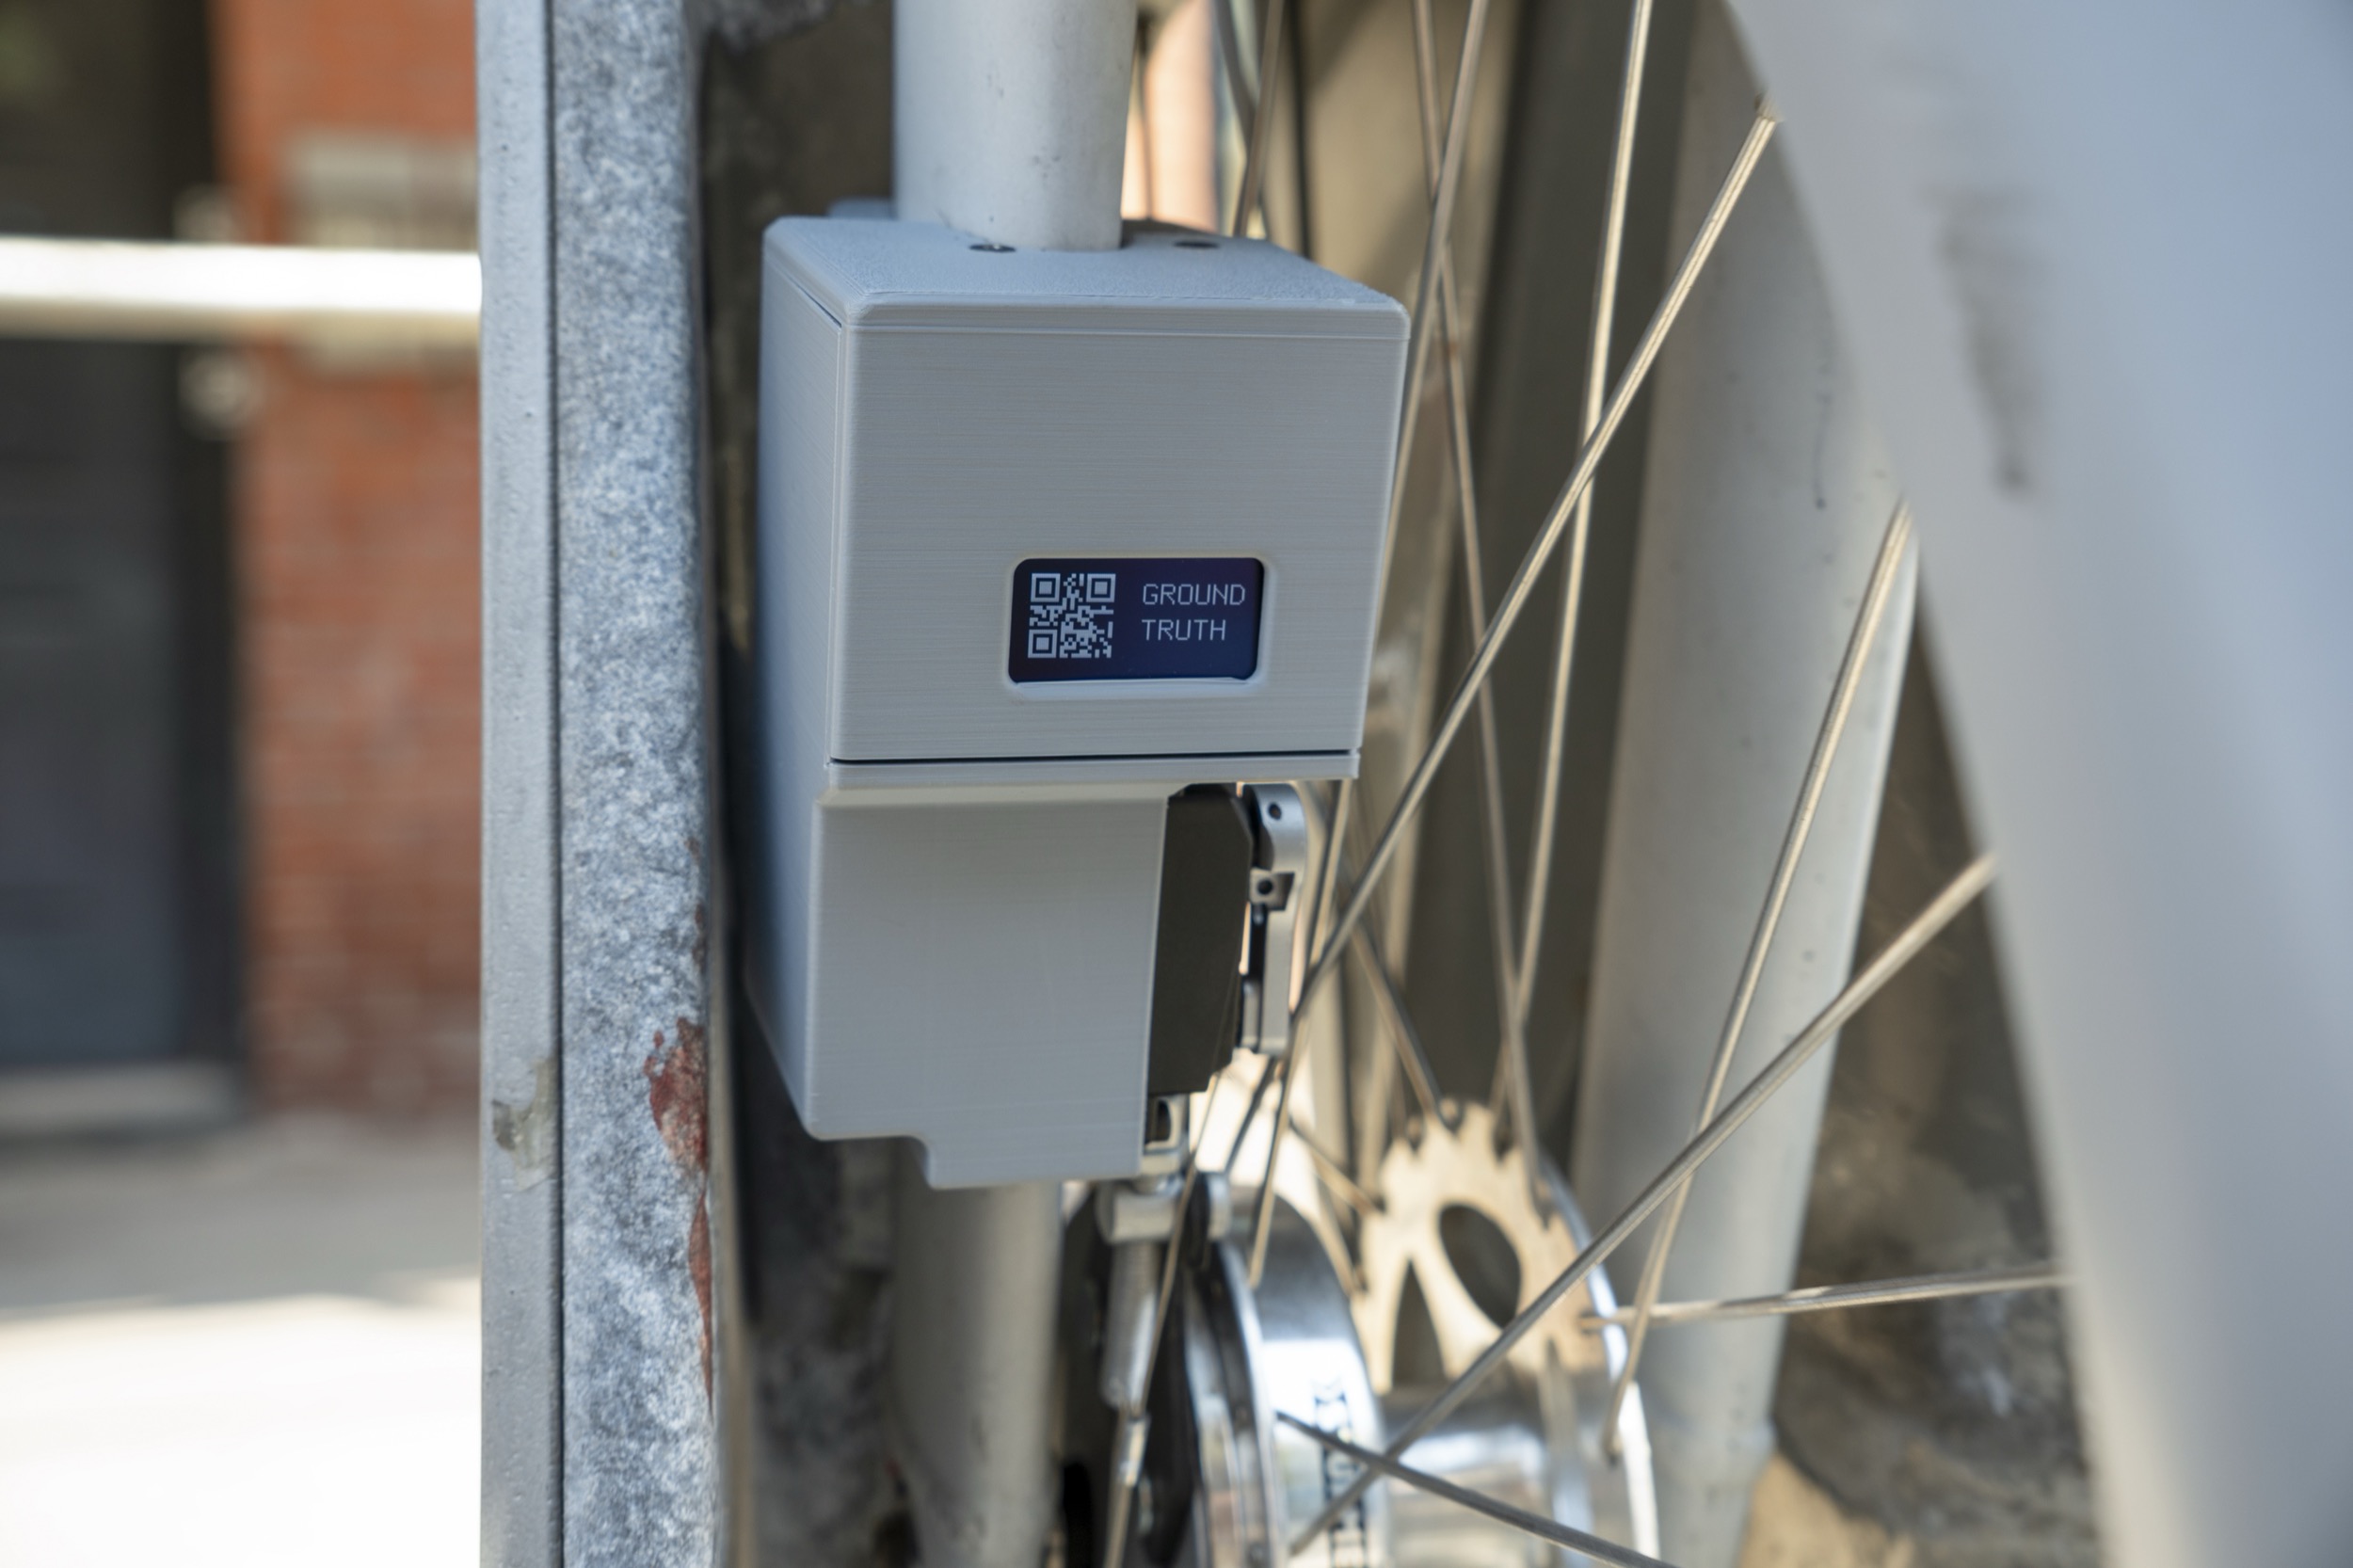
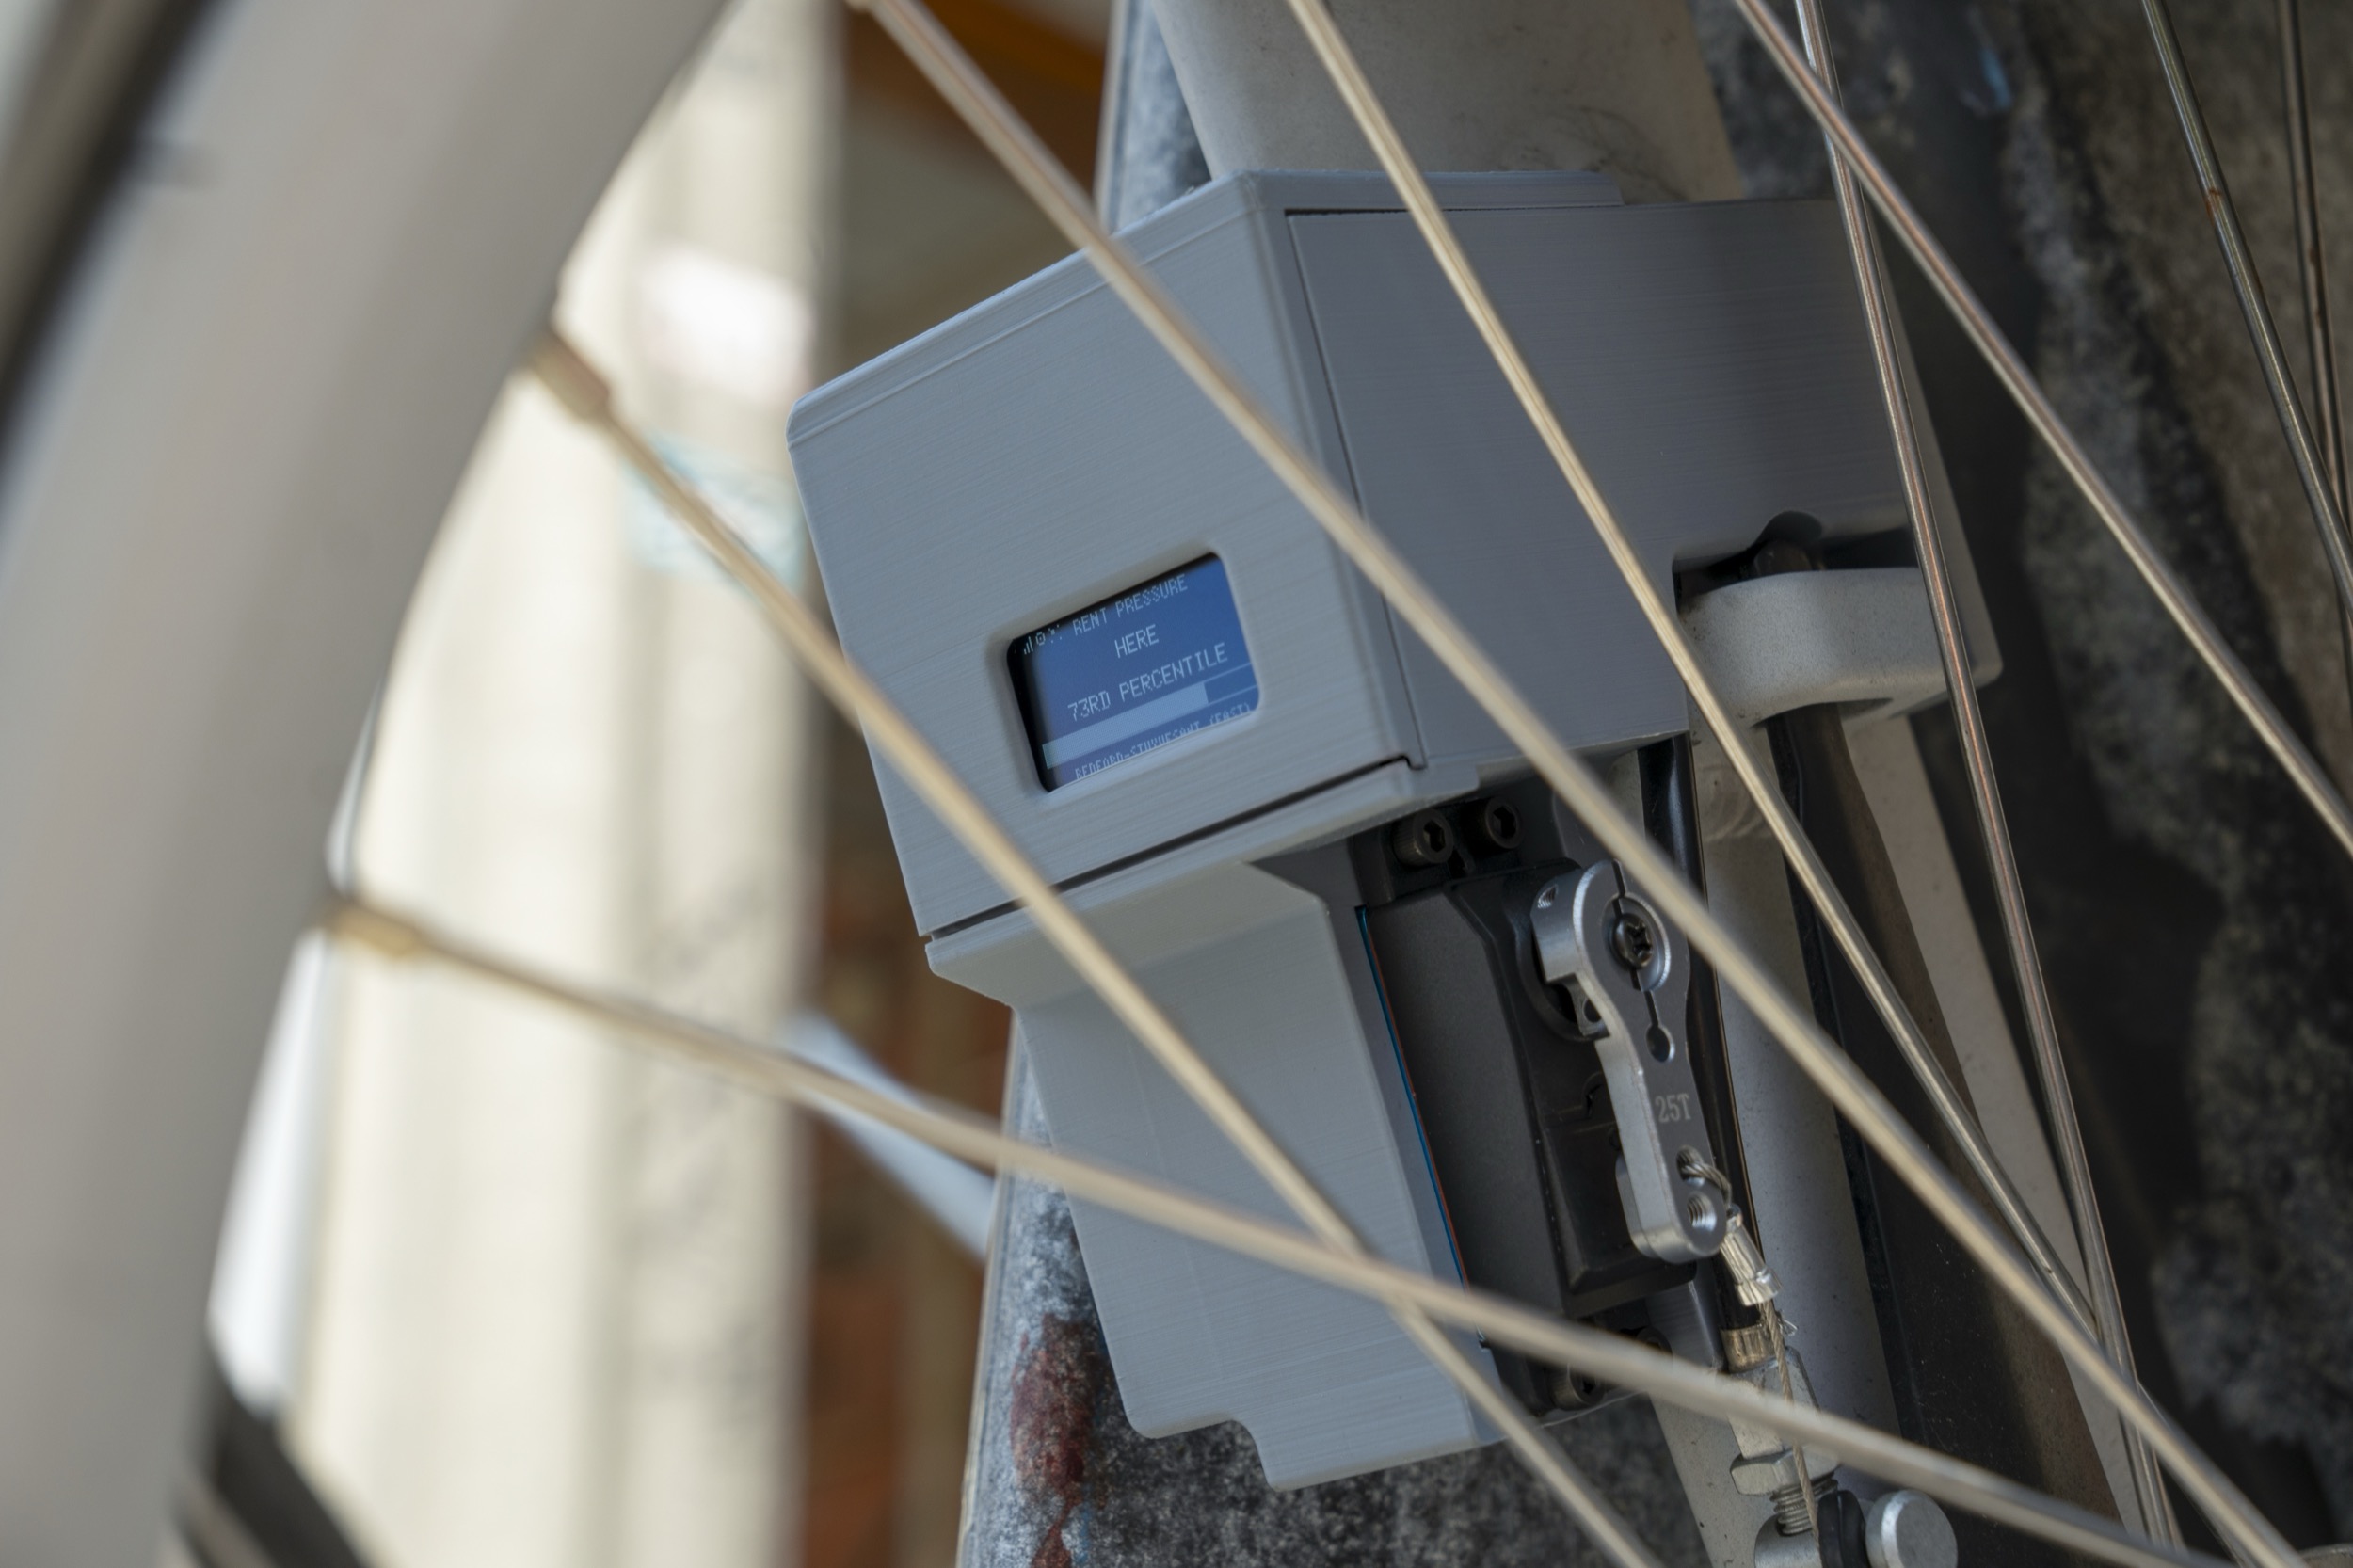
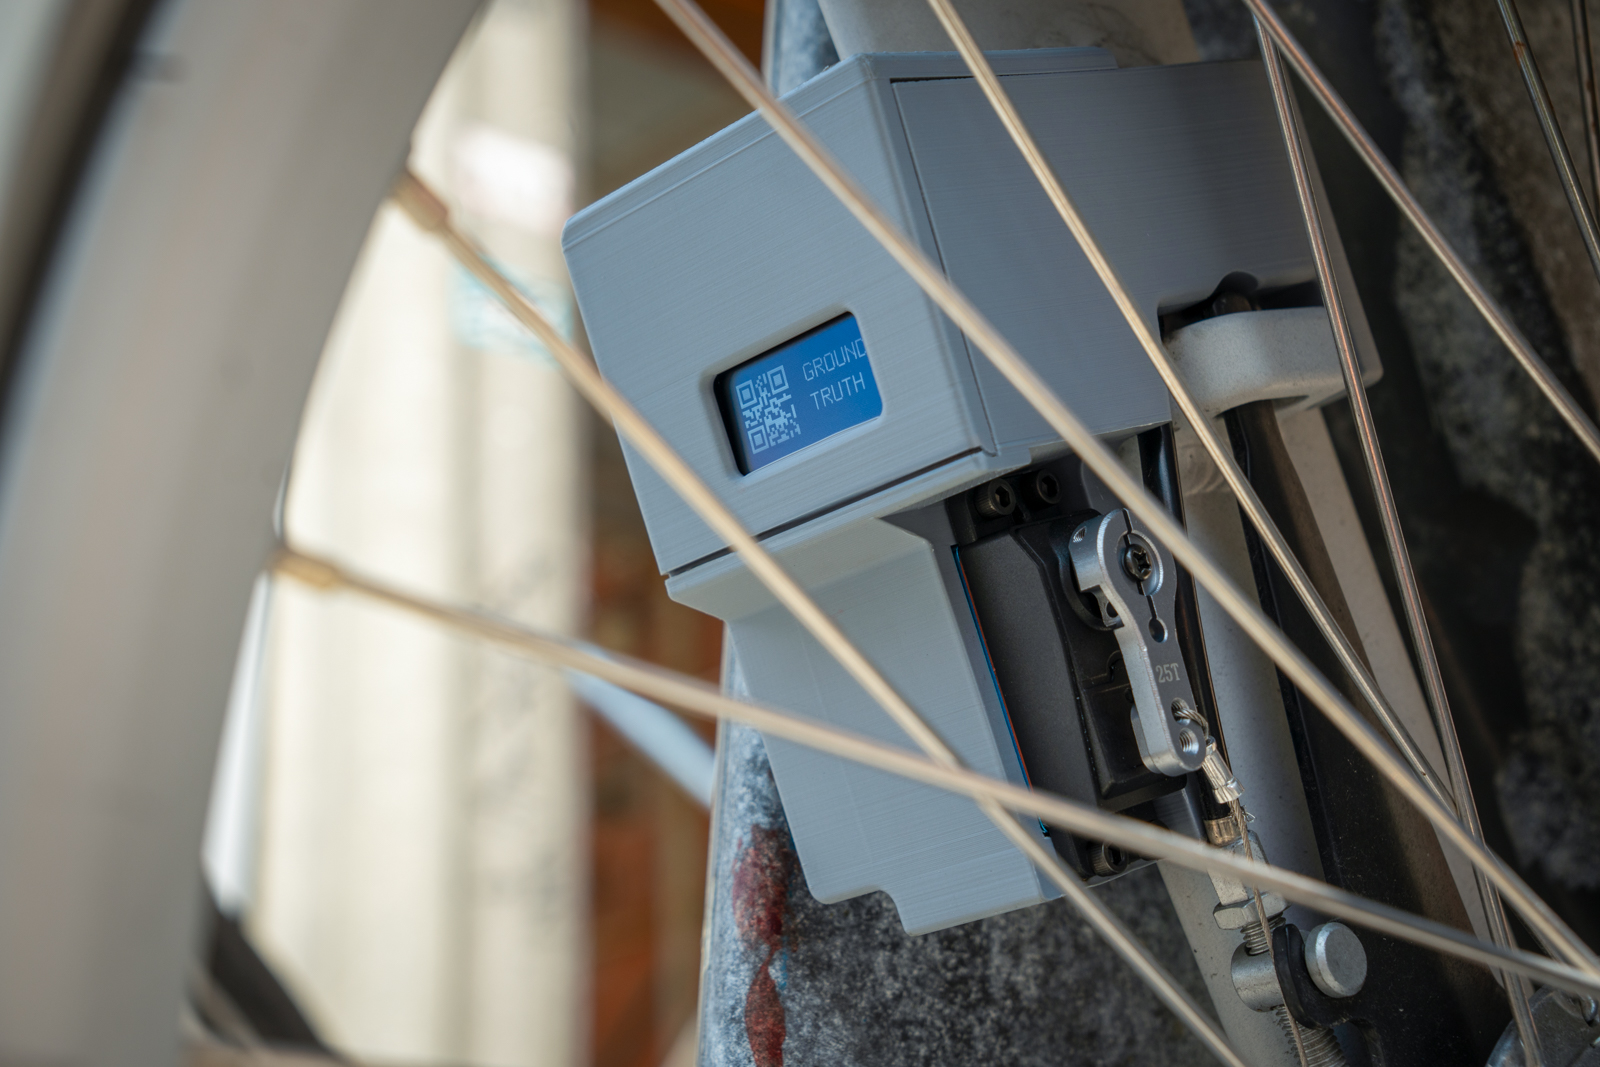
Ground Truth is a device that attaches to any Citi Bike. It uses GPS to look up corresponding hyperlocal rent burden data to change the pedal resistance. As a rider moves through areas where housing costs consume a greater share of residents’ incomes, the bike’s resistance increases. When they enter a more affordable area, the resistance eases.
The project translates an economic abstraction into a direct, physical experience. Rather than asking people to interpret inequality through a heat map, chart, or census statistic, it asks them to encounter the underlying data through their own effort and movement.
Housing affordability is a public, structural issue felt and experienced in deeply private, personal ways. It determines how long people commute, how much space they occupy, how many people they can comfortably live with. It affects whether people can remain close to their families and communities or are forced to move farther away.
Yet housing affordability is usually communicated through detached forms: percentages, median rents, income ratios, and color-coded maps. Those representations may be useful, but they can make the issue seem orderly and distant. They rarely communicate the exhaustion of spending most of one’s income on rent, or the cumulative pressure of trying to remain in a rapidly changing neighborhood.
Ground Truth intervenes by treating tactility not simply as texture or touch, but as friction and labor unfolding over time. Each pedal stroke becomes a small encounter with the data’s underlying representations.
Housing pressure is rarely experienced as an isolated event. It builds gradually and structures everyday decisions. Through this project, bicycle rides become temporal performances in which exertion and geography converge into a form of haptic storytelling that conventional visualizations cannot reproduce.
Datasets
Ground Truth uses American Community Survey (ACS) data at the block-group level, constructing a relatively detailed picture of housing affordability across New York City.
The main measure is rent burden: the percentage of a household’s income spent on rent and utilities. This follows HUD’s longstanding 30 percent standard, which considers households cost-burdened when their housing expenses exceed 30 percent of their income. Rent or income alone do not tell us whether housing is actually affordable. The same monthly rent can be manageable for one household and overwhelming for another.
The dataset combined two specific indicators: the median share of income spent on rent, and the percentage of renter households spending at least half of their income on housing, which is considered severely rent-burdened. These were normalized and blended into a single affordability score so that the data could reflect both the typical pressure in an area and the number of households facing especially extreme costs.
Since some wealthier households may choose to spend a large share of their income on housing without experiencing the same level of financial strain, the top quantile was removed from the final dataset.
The final score was then connected to the coordinates of each block group. The device stores a simplified version of that data locally, and as the bike’s GPS position changes, the microcontroller finds the corresponding value and translates it into a level of physical resistance.
The interactive map uses the same underlying data, so that the visual map and the physical ride become two different ways of reading the same affordability landscape.
The interactive map below shows the blended median and severe rent burden census datasets across NYC.
It has two different views of rent pressure: per-block and contiguous. The per-block perspective shows the rent-burden percentile of a specific block group as an elevated mound. The contiguous perspective borrows the visual language of topographic survey maps. Neighboring block groups are smoothed into a continuous surface.
Device
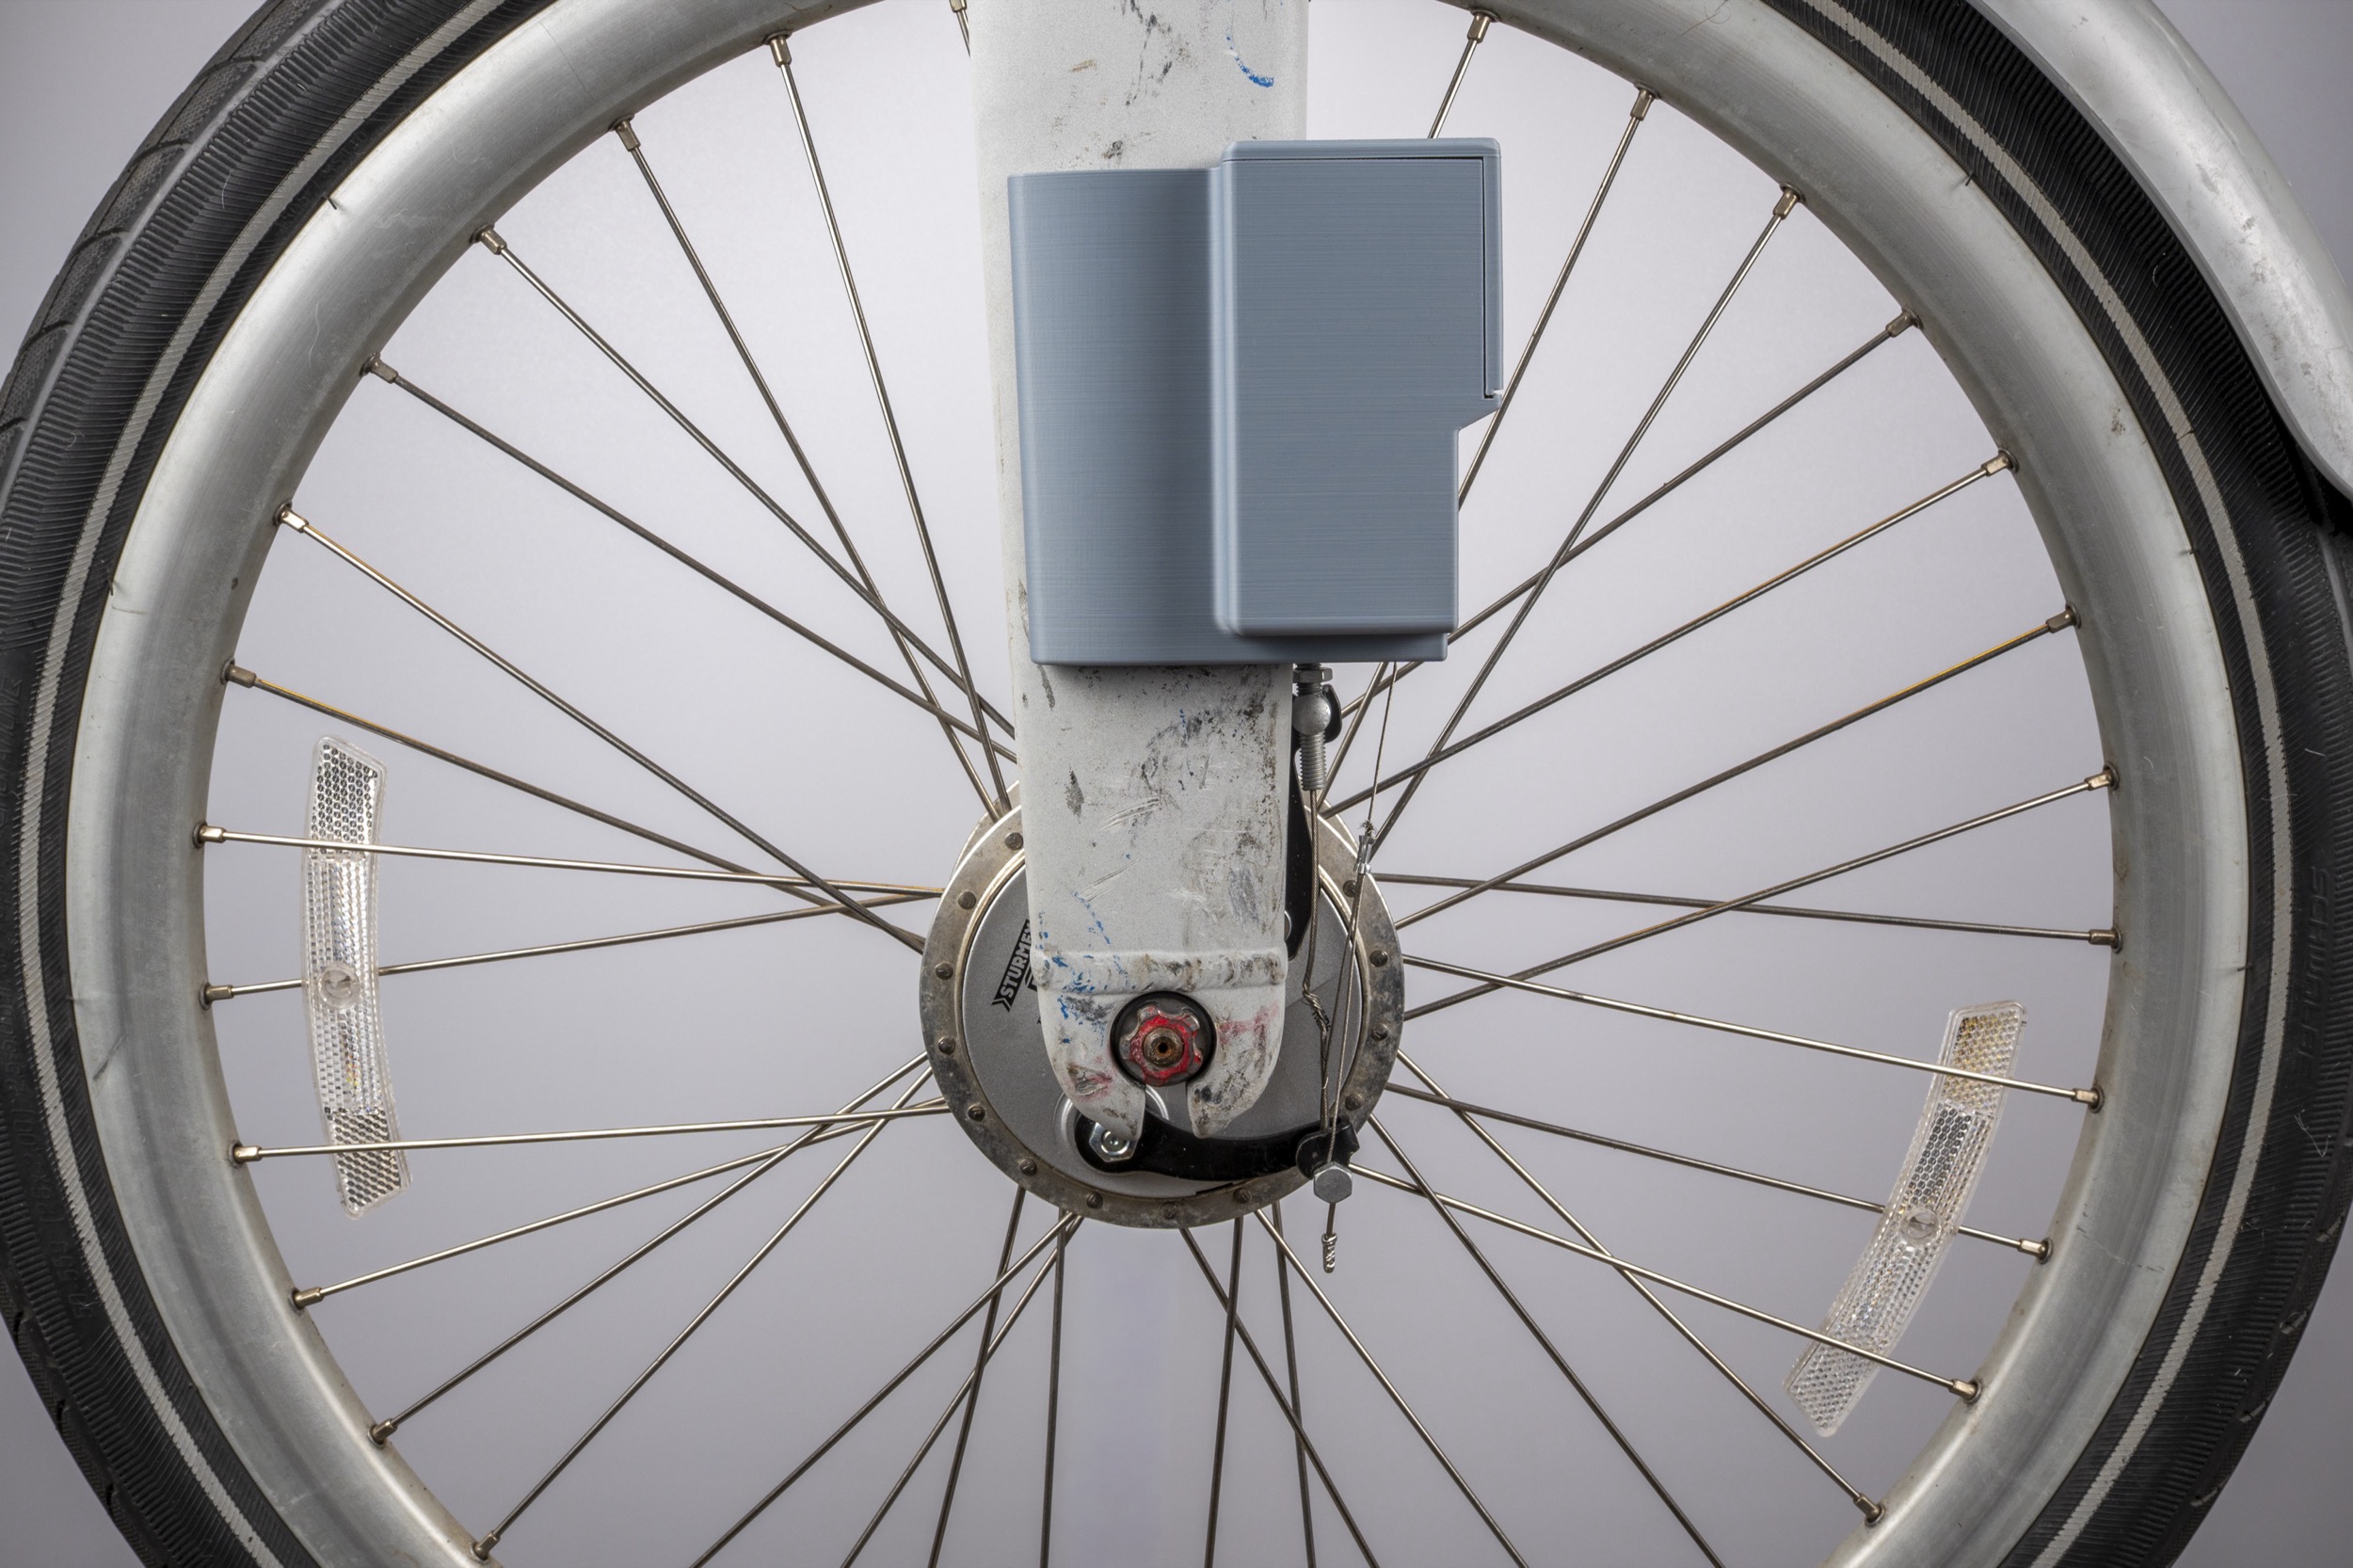
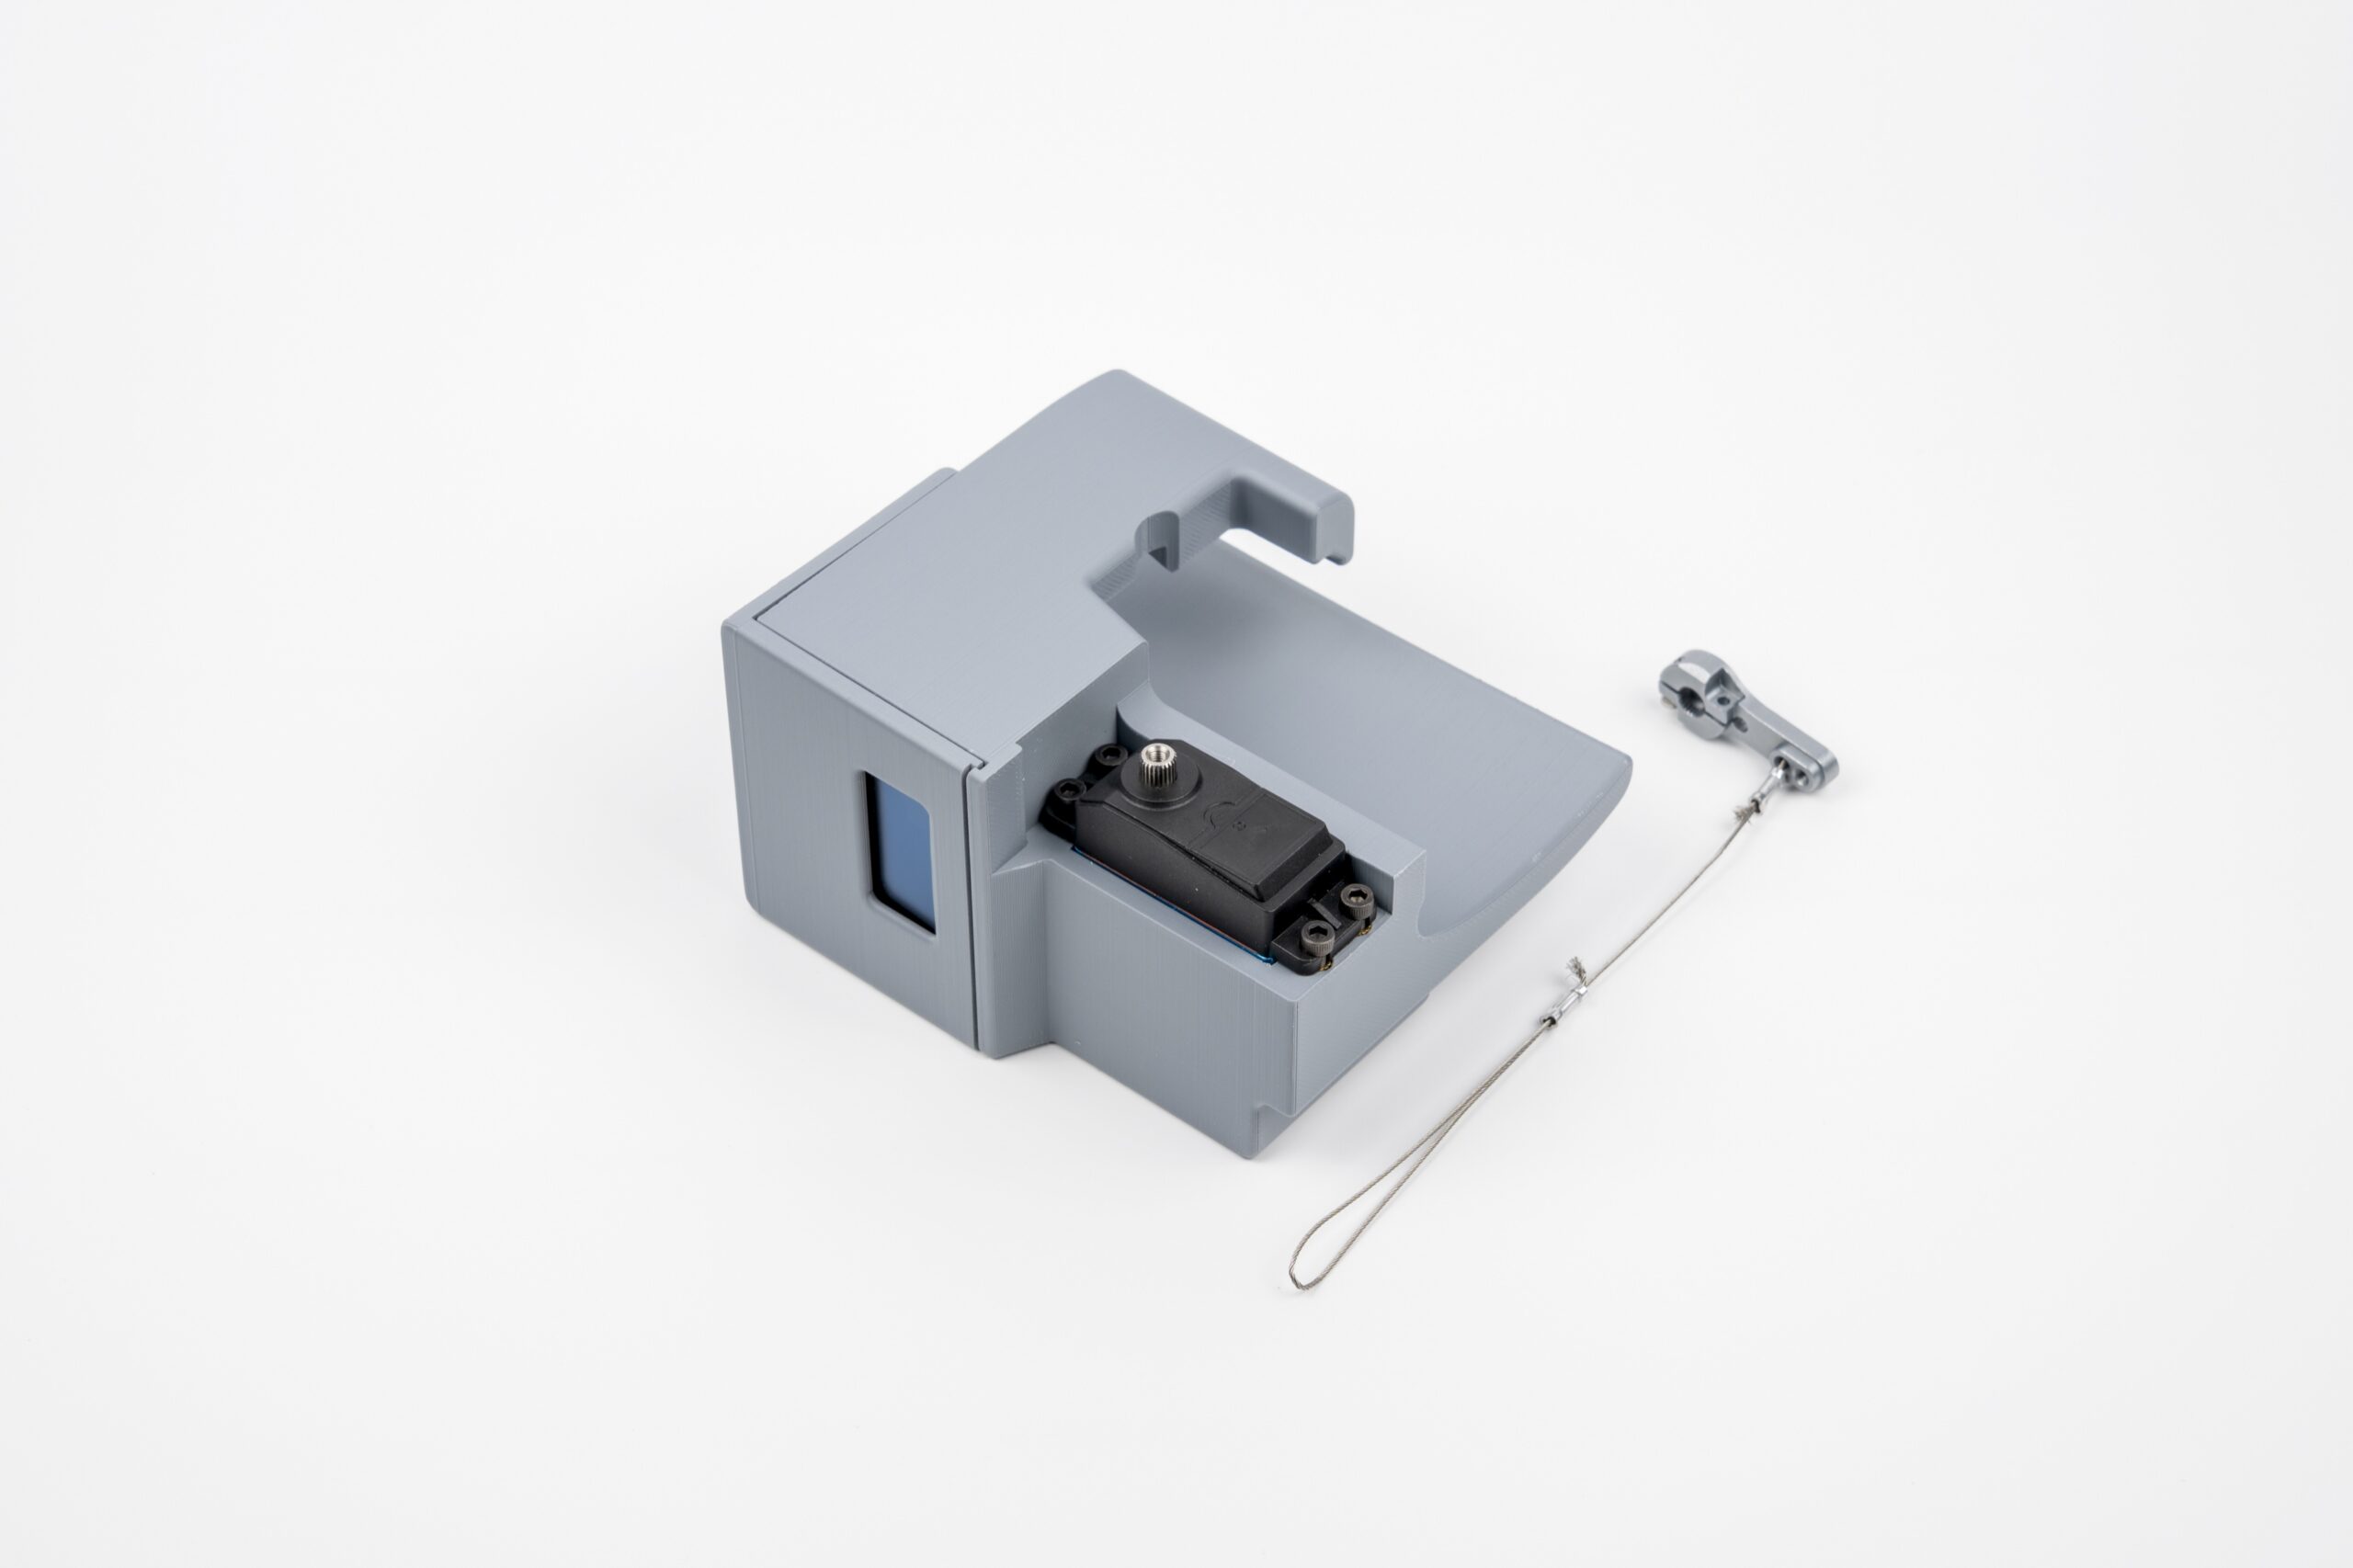
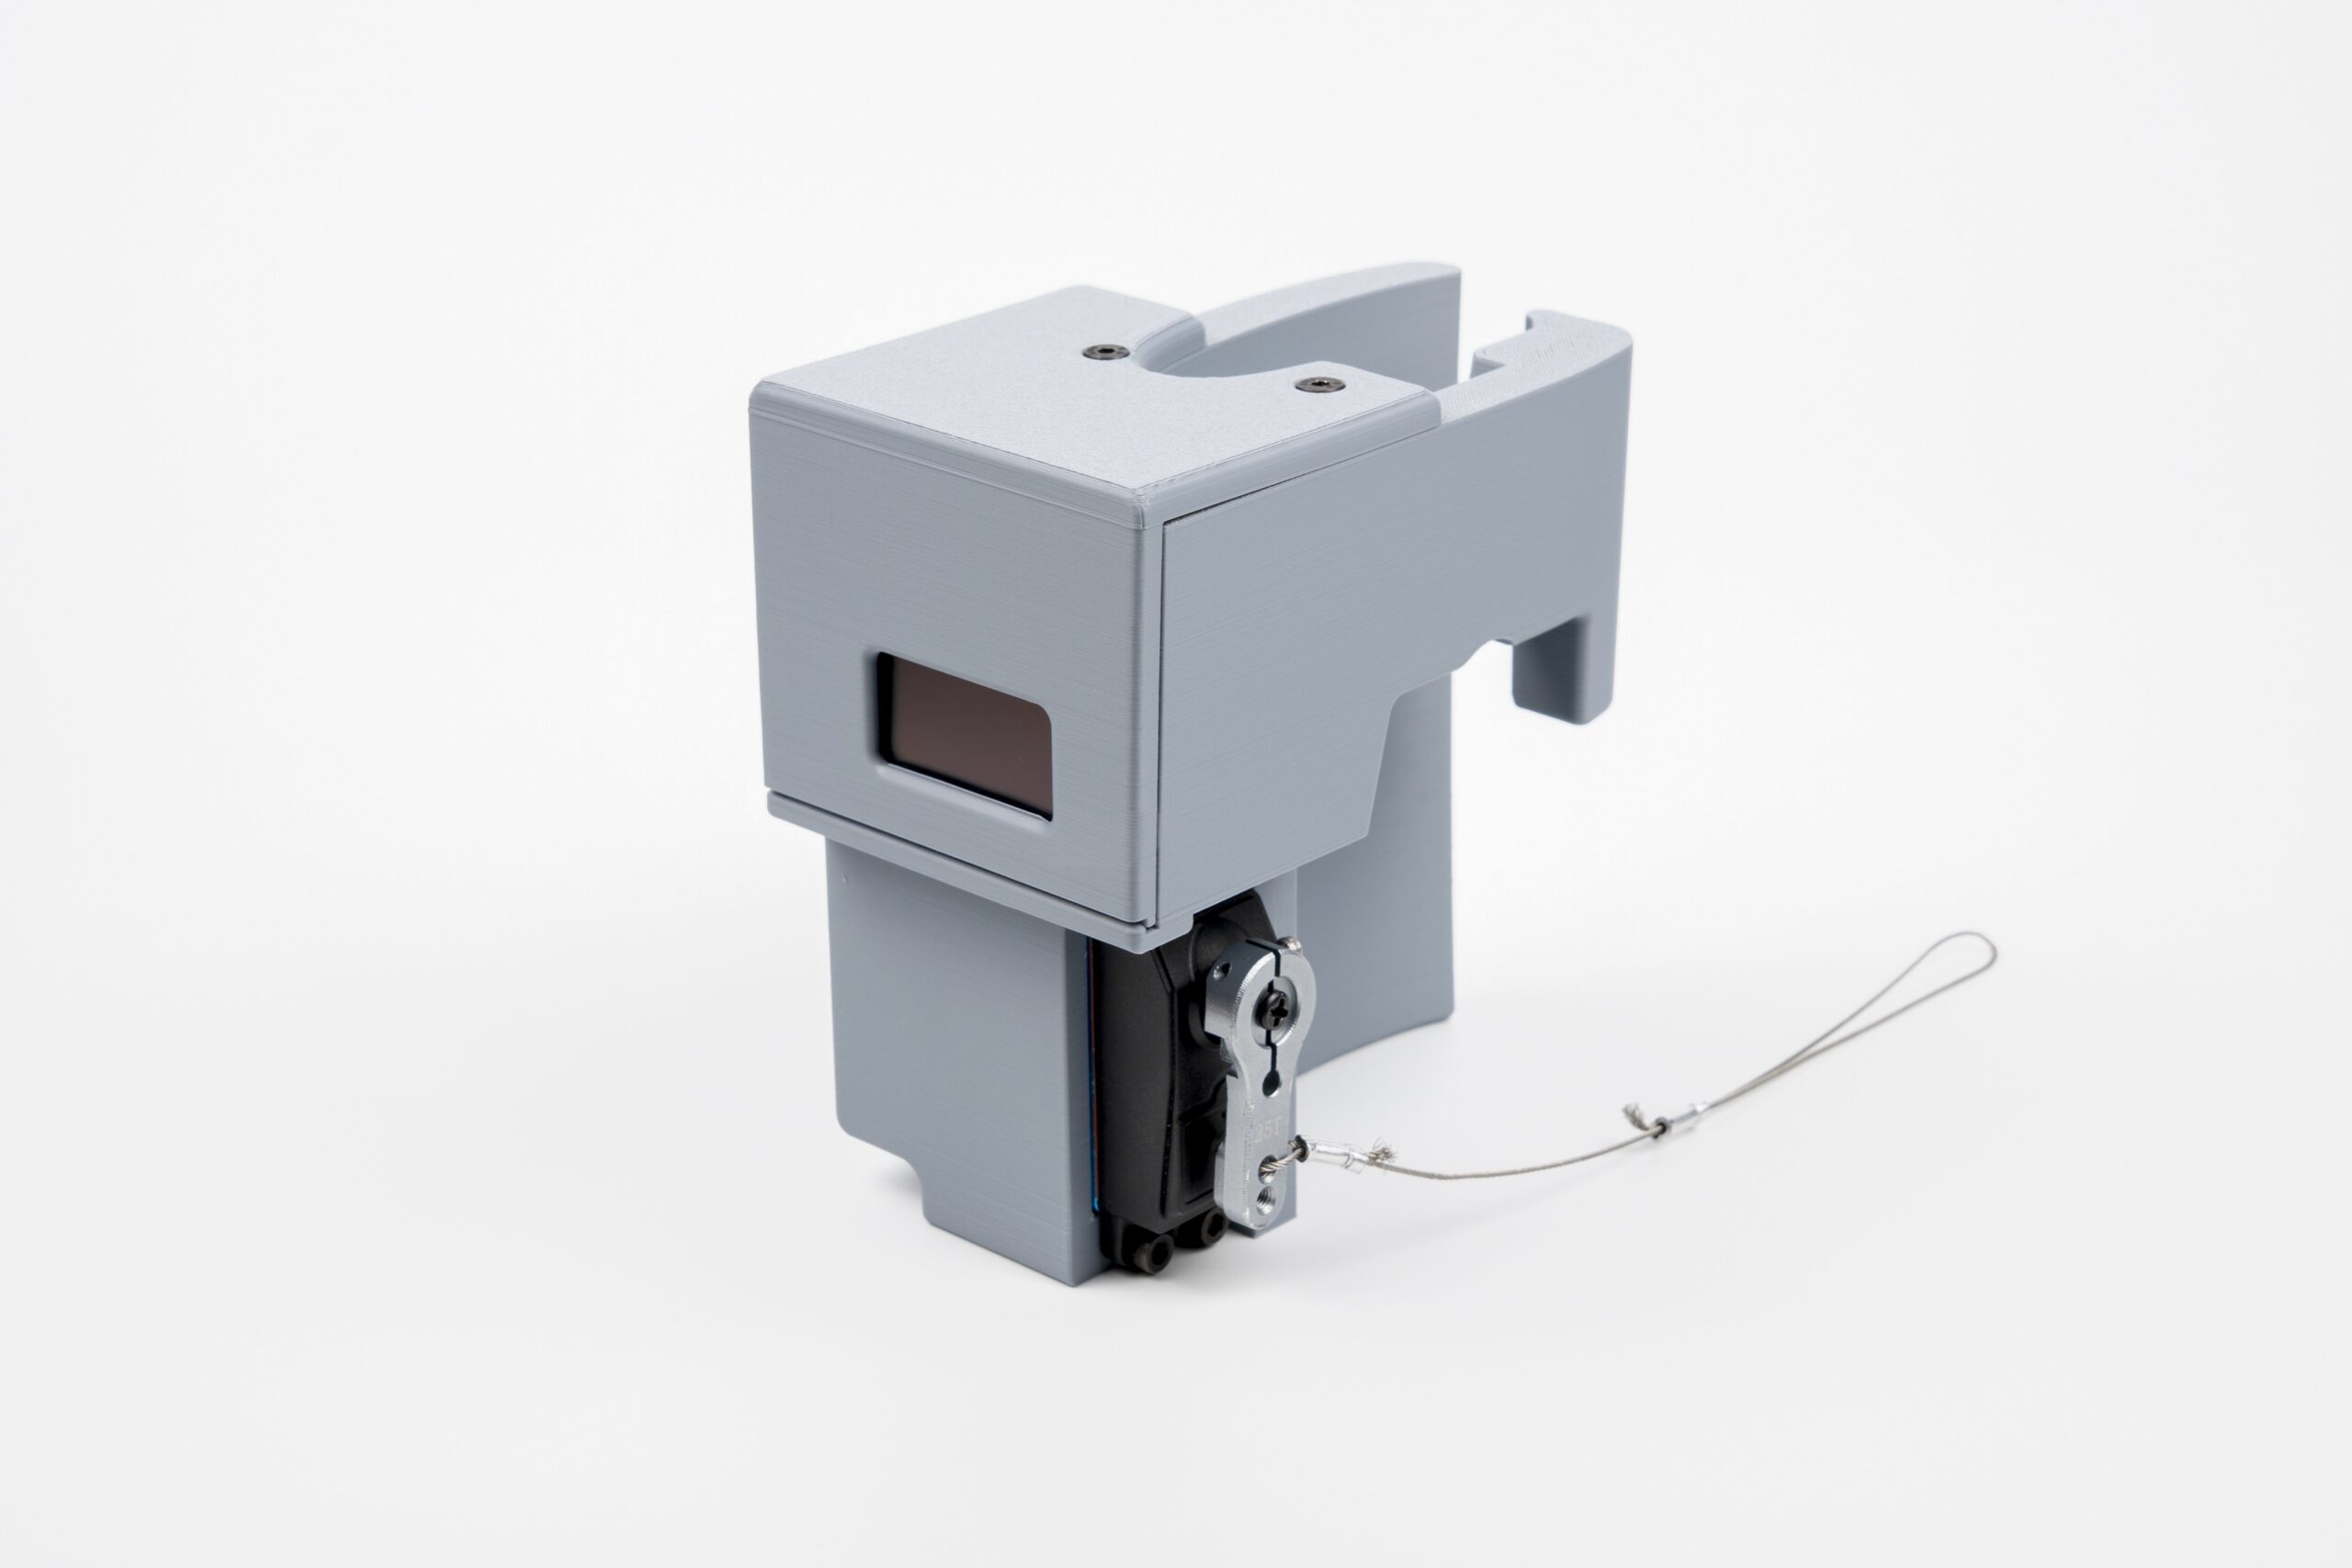
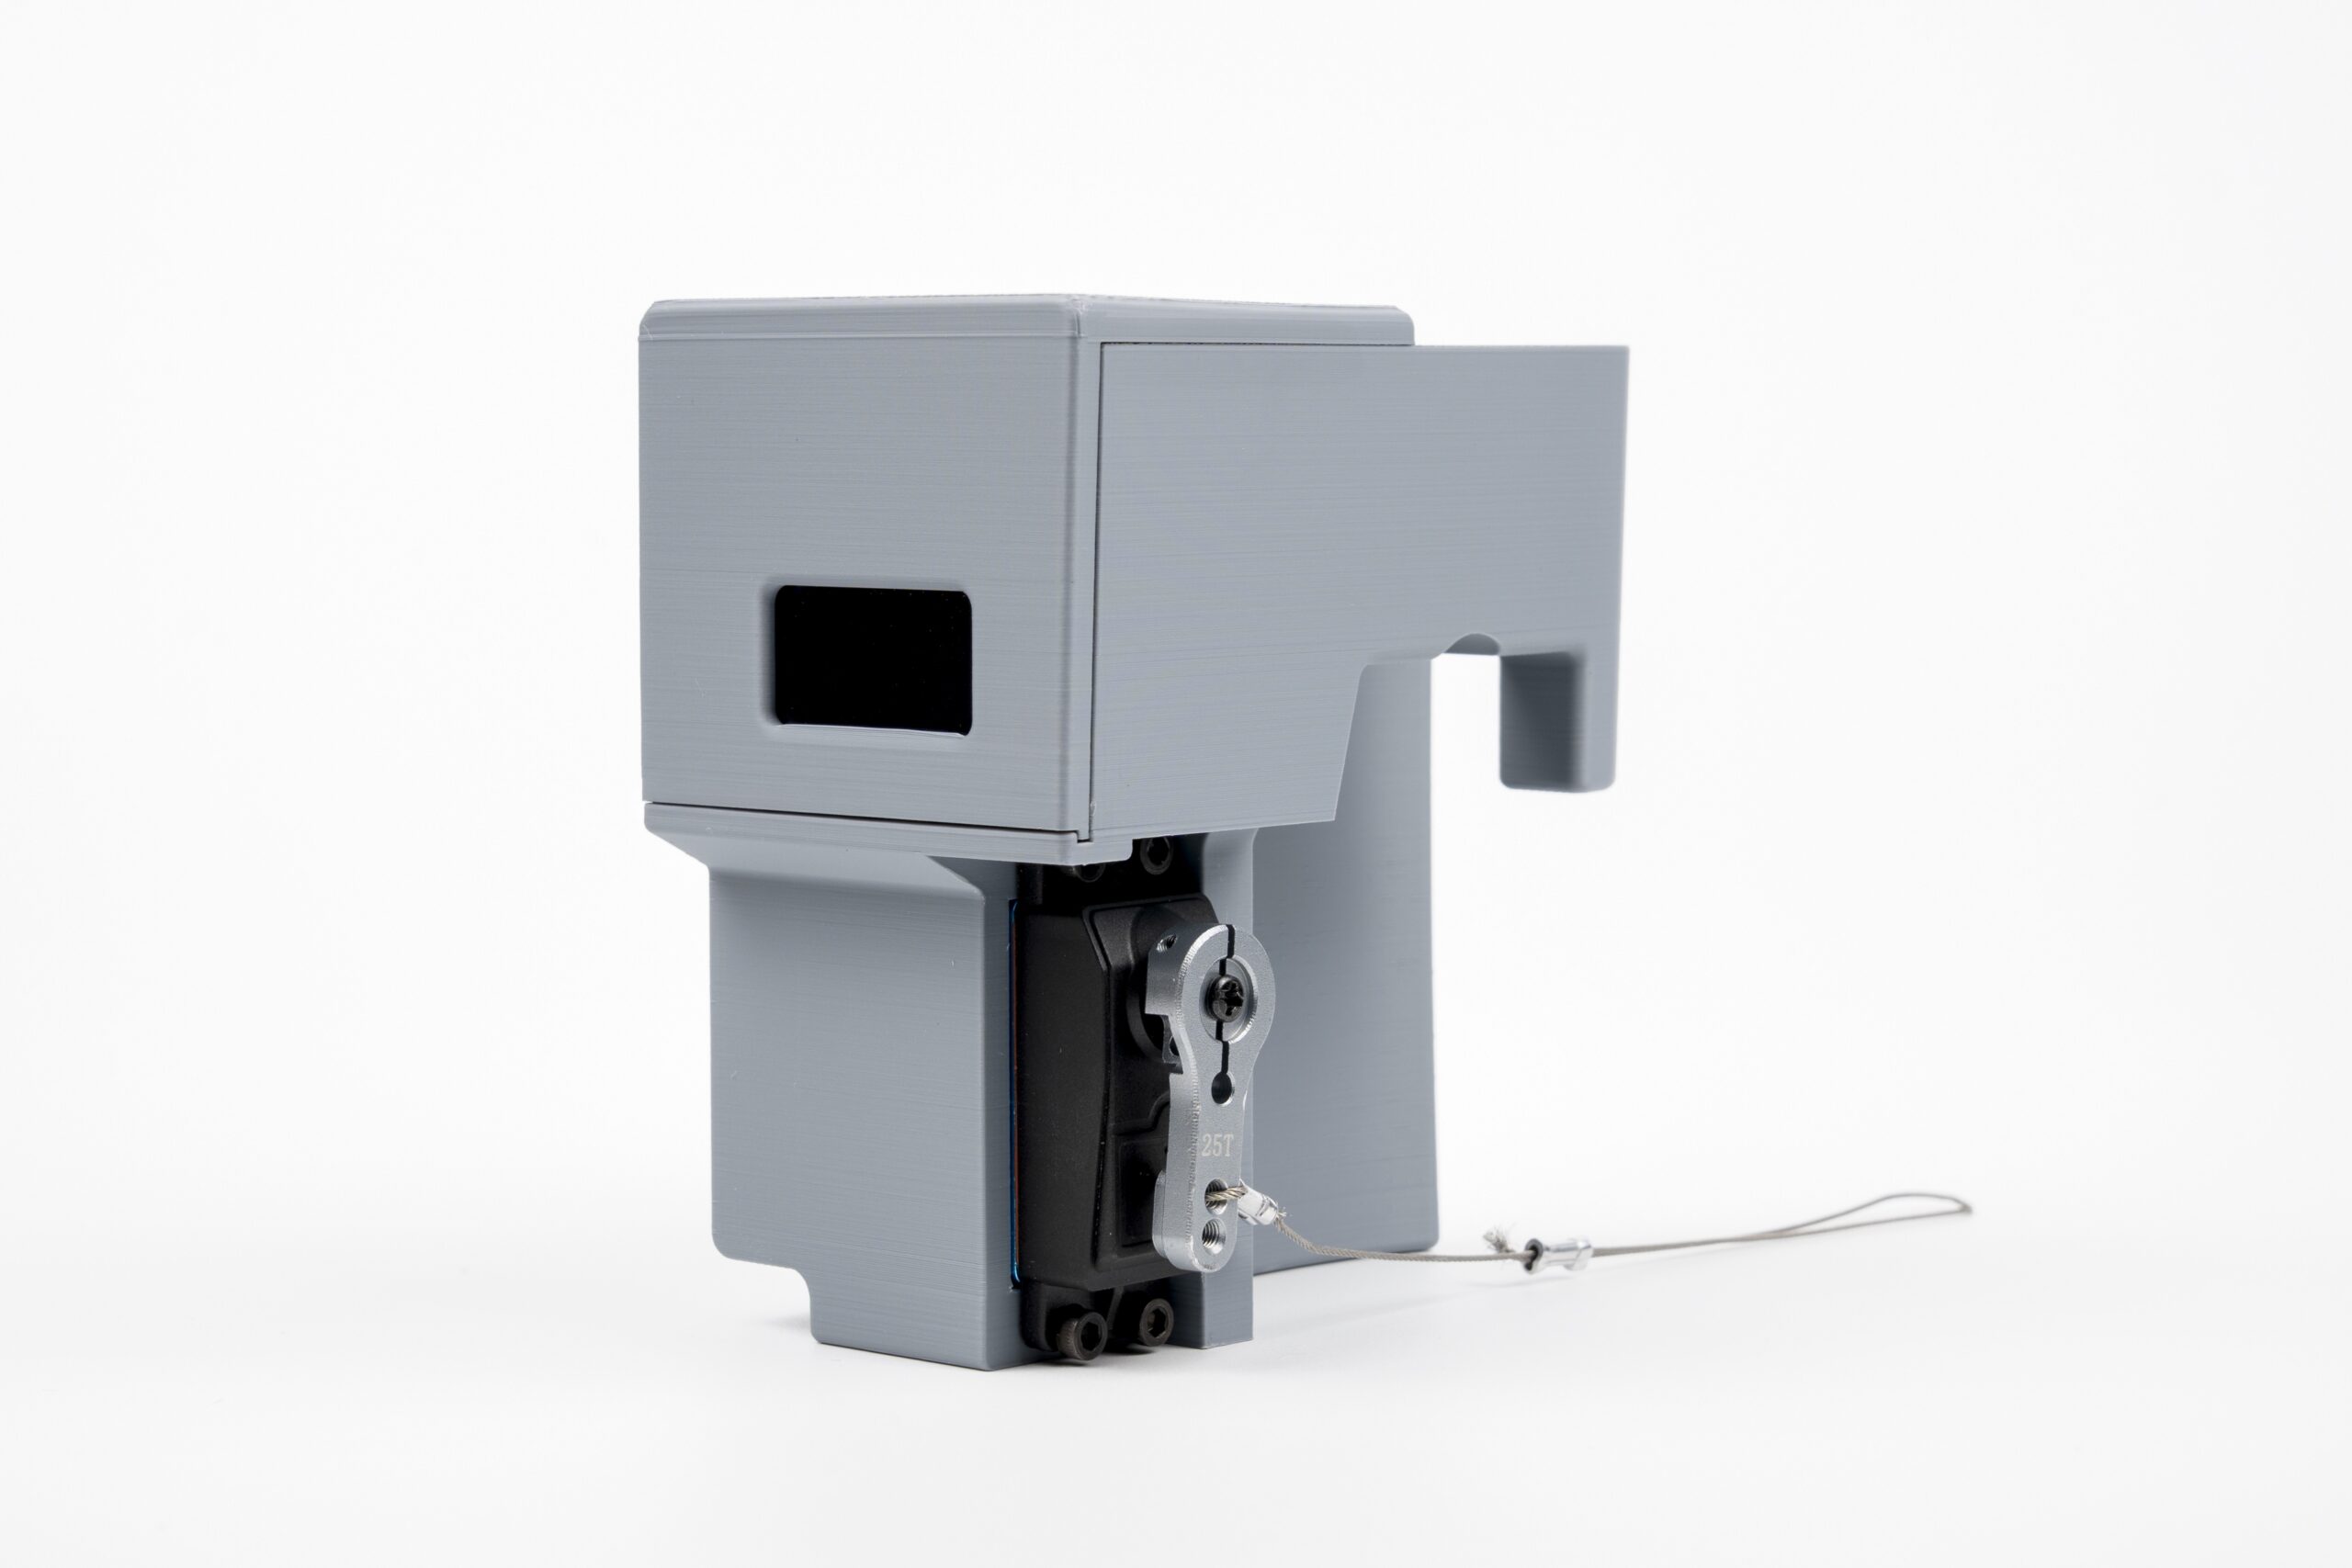
The device attaches to the front fork of a docked Citi Bike and overrides the front-brake, to adjust pedal resistance according to hyper-local rent burden data.
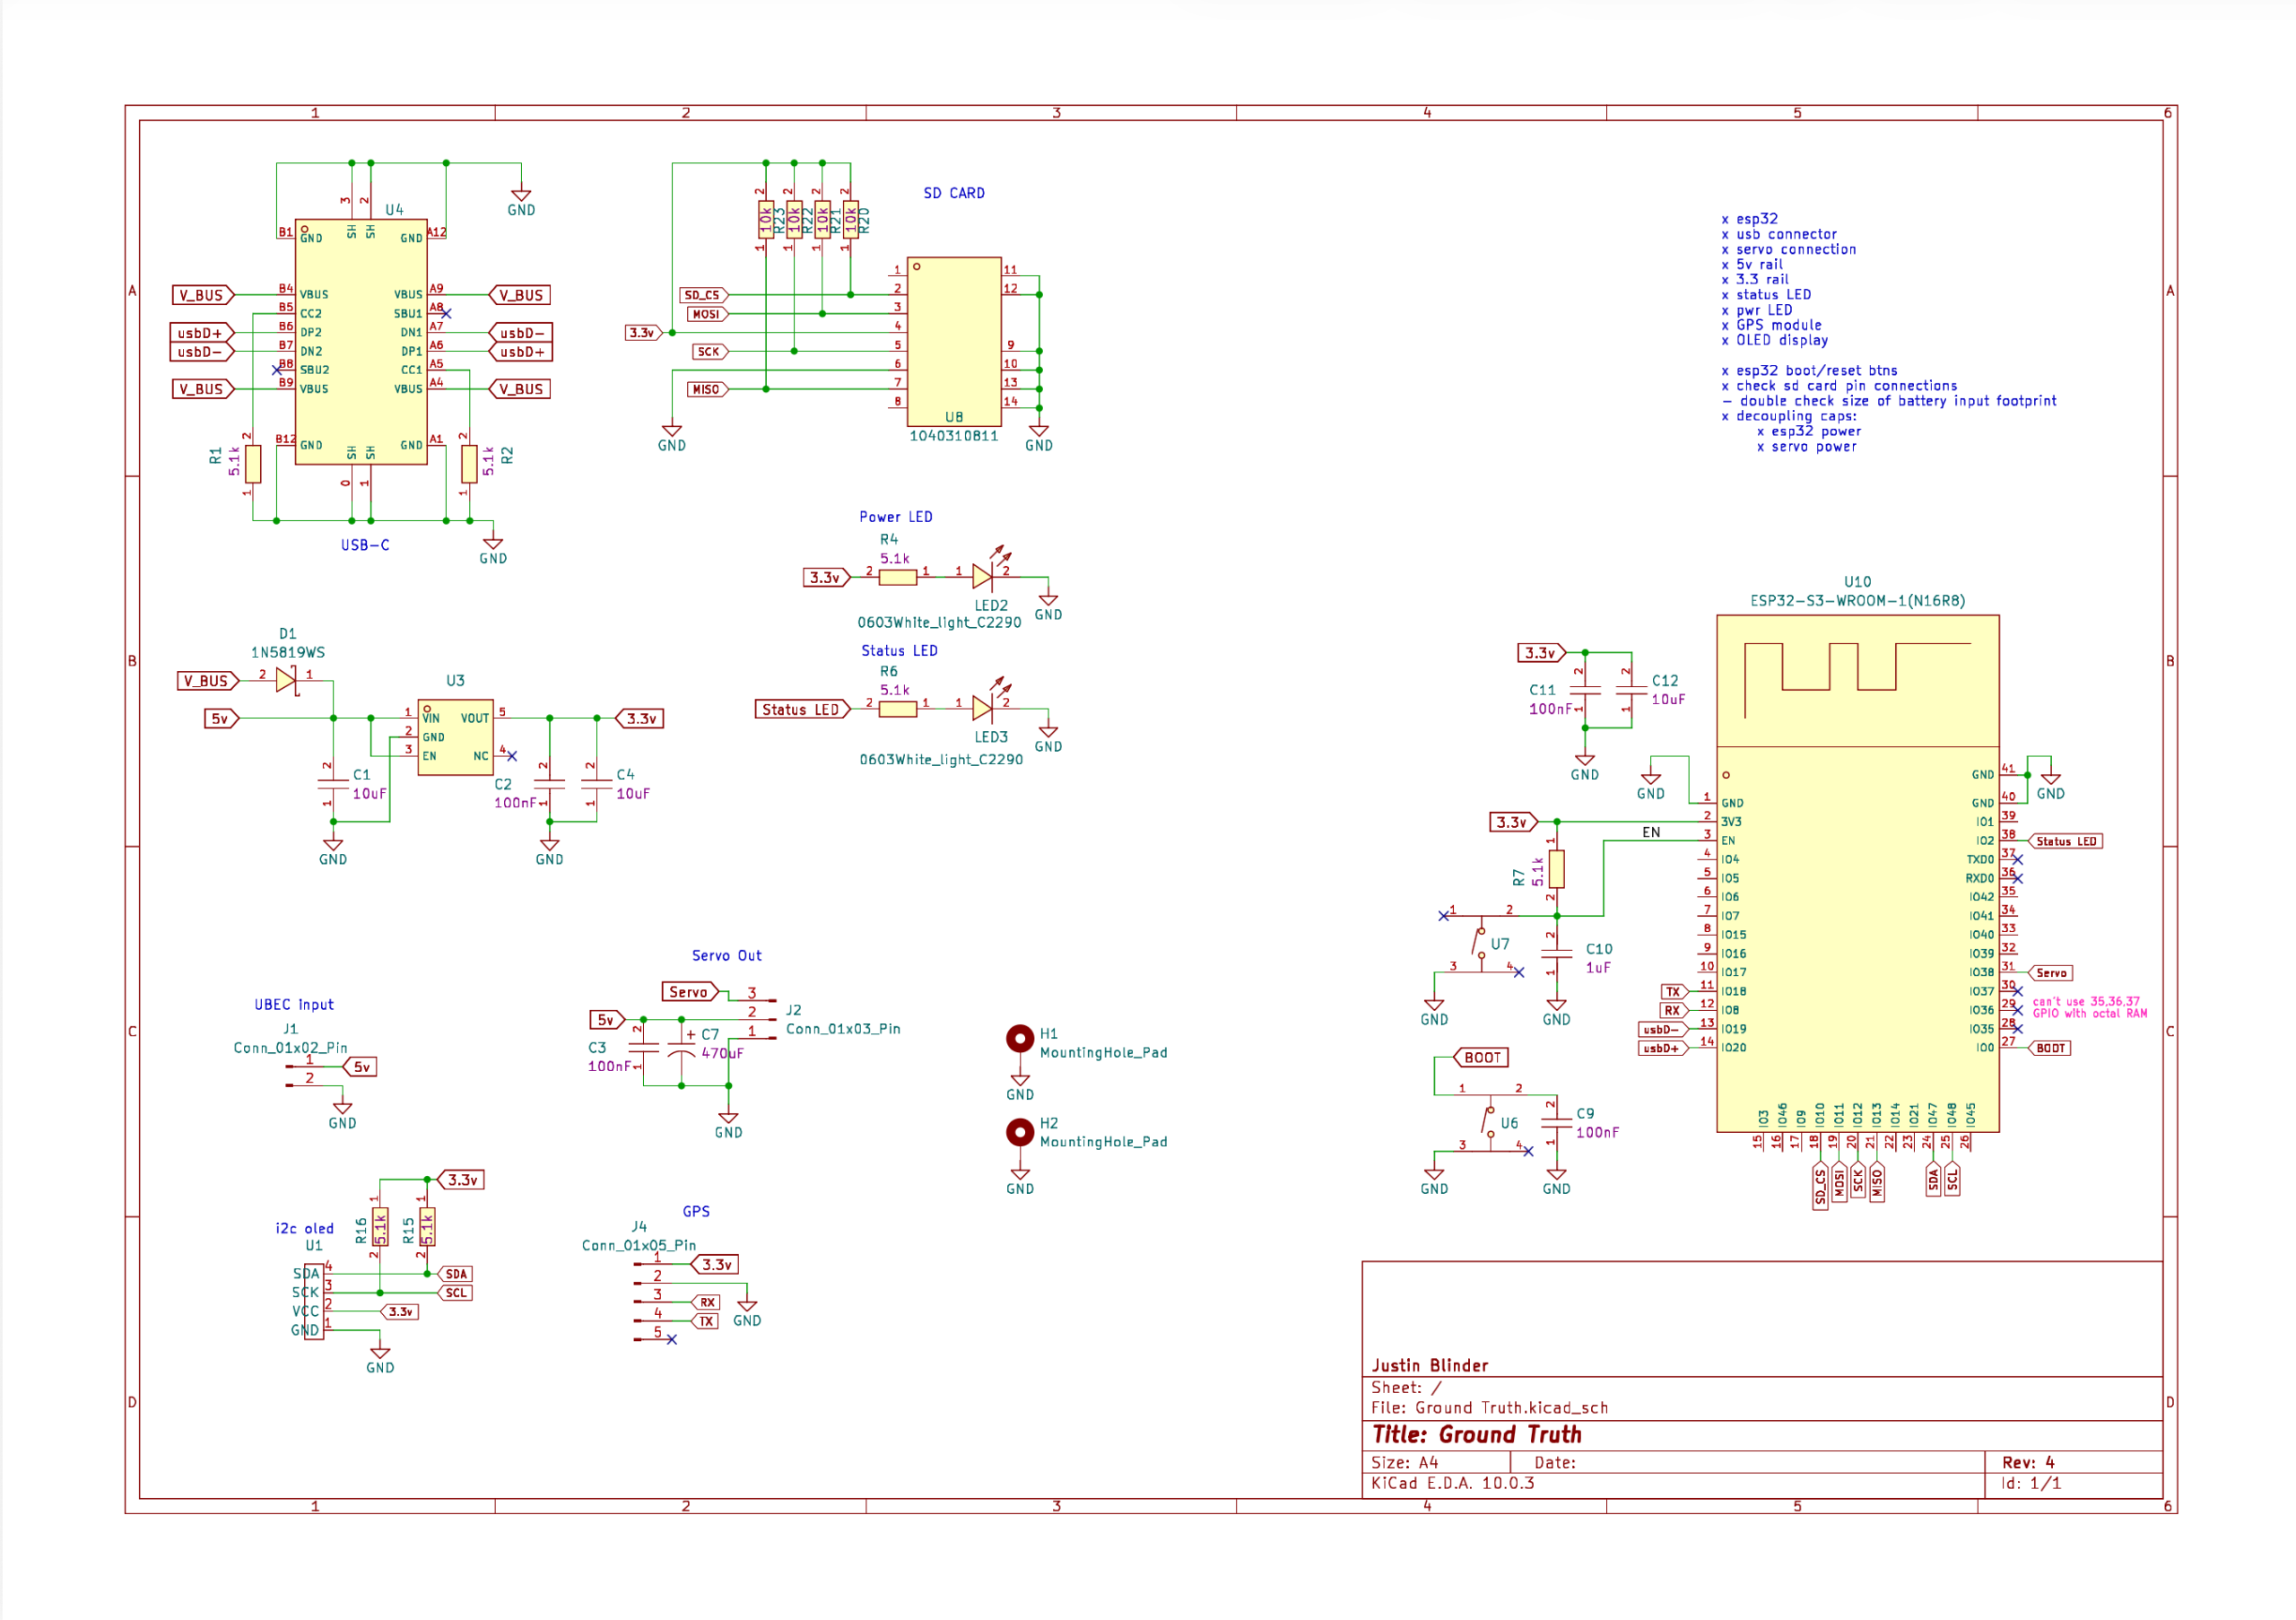
The core device was built using a GPS module, ESP32S3 microcontroller, high-torque servo motor, and an SD card reader containing a custom housing affordability dataset. As a rider moves through the city, the GPS continually polls the bike’s location. At regular intervals, the microcontroller compares those coordinates with the geographic data stored on the SD card, identifies the local rent burden, and maps that value to a specific servo angle.
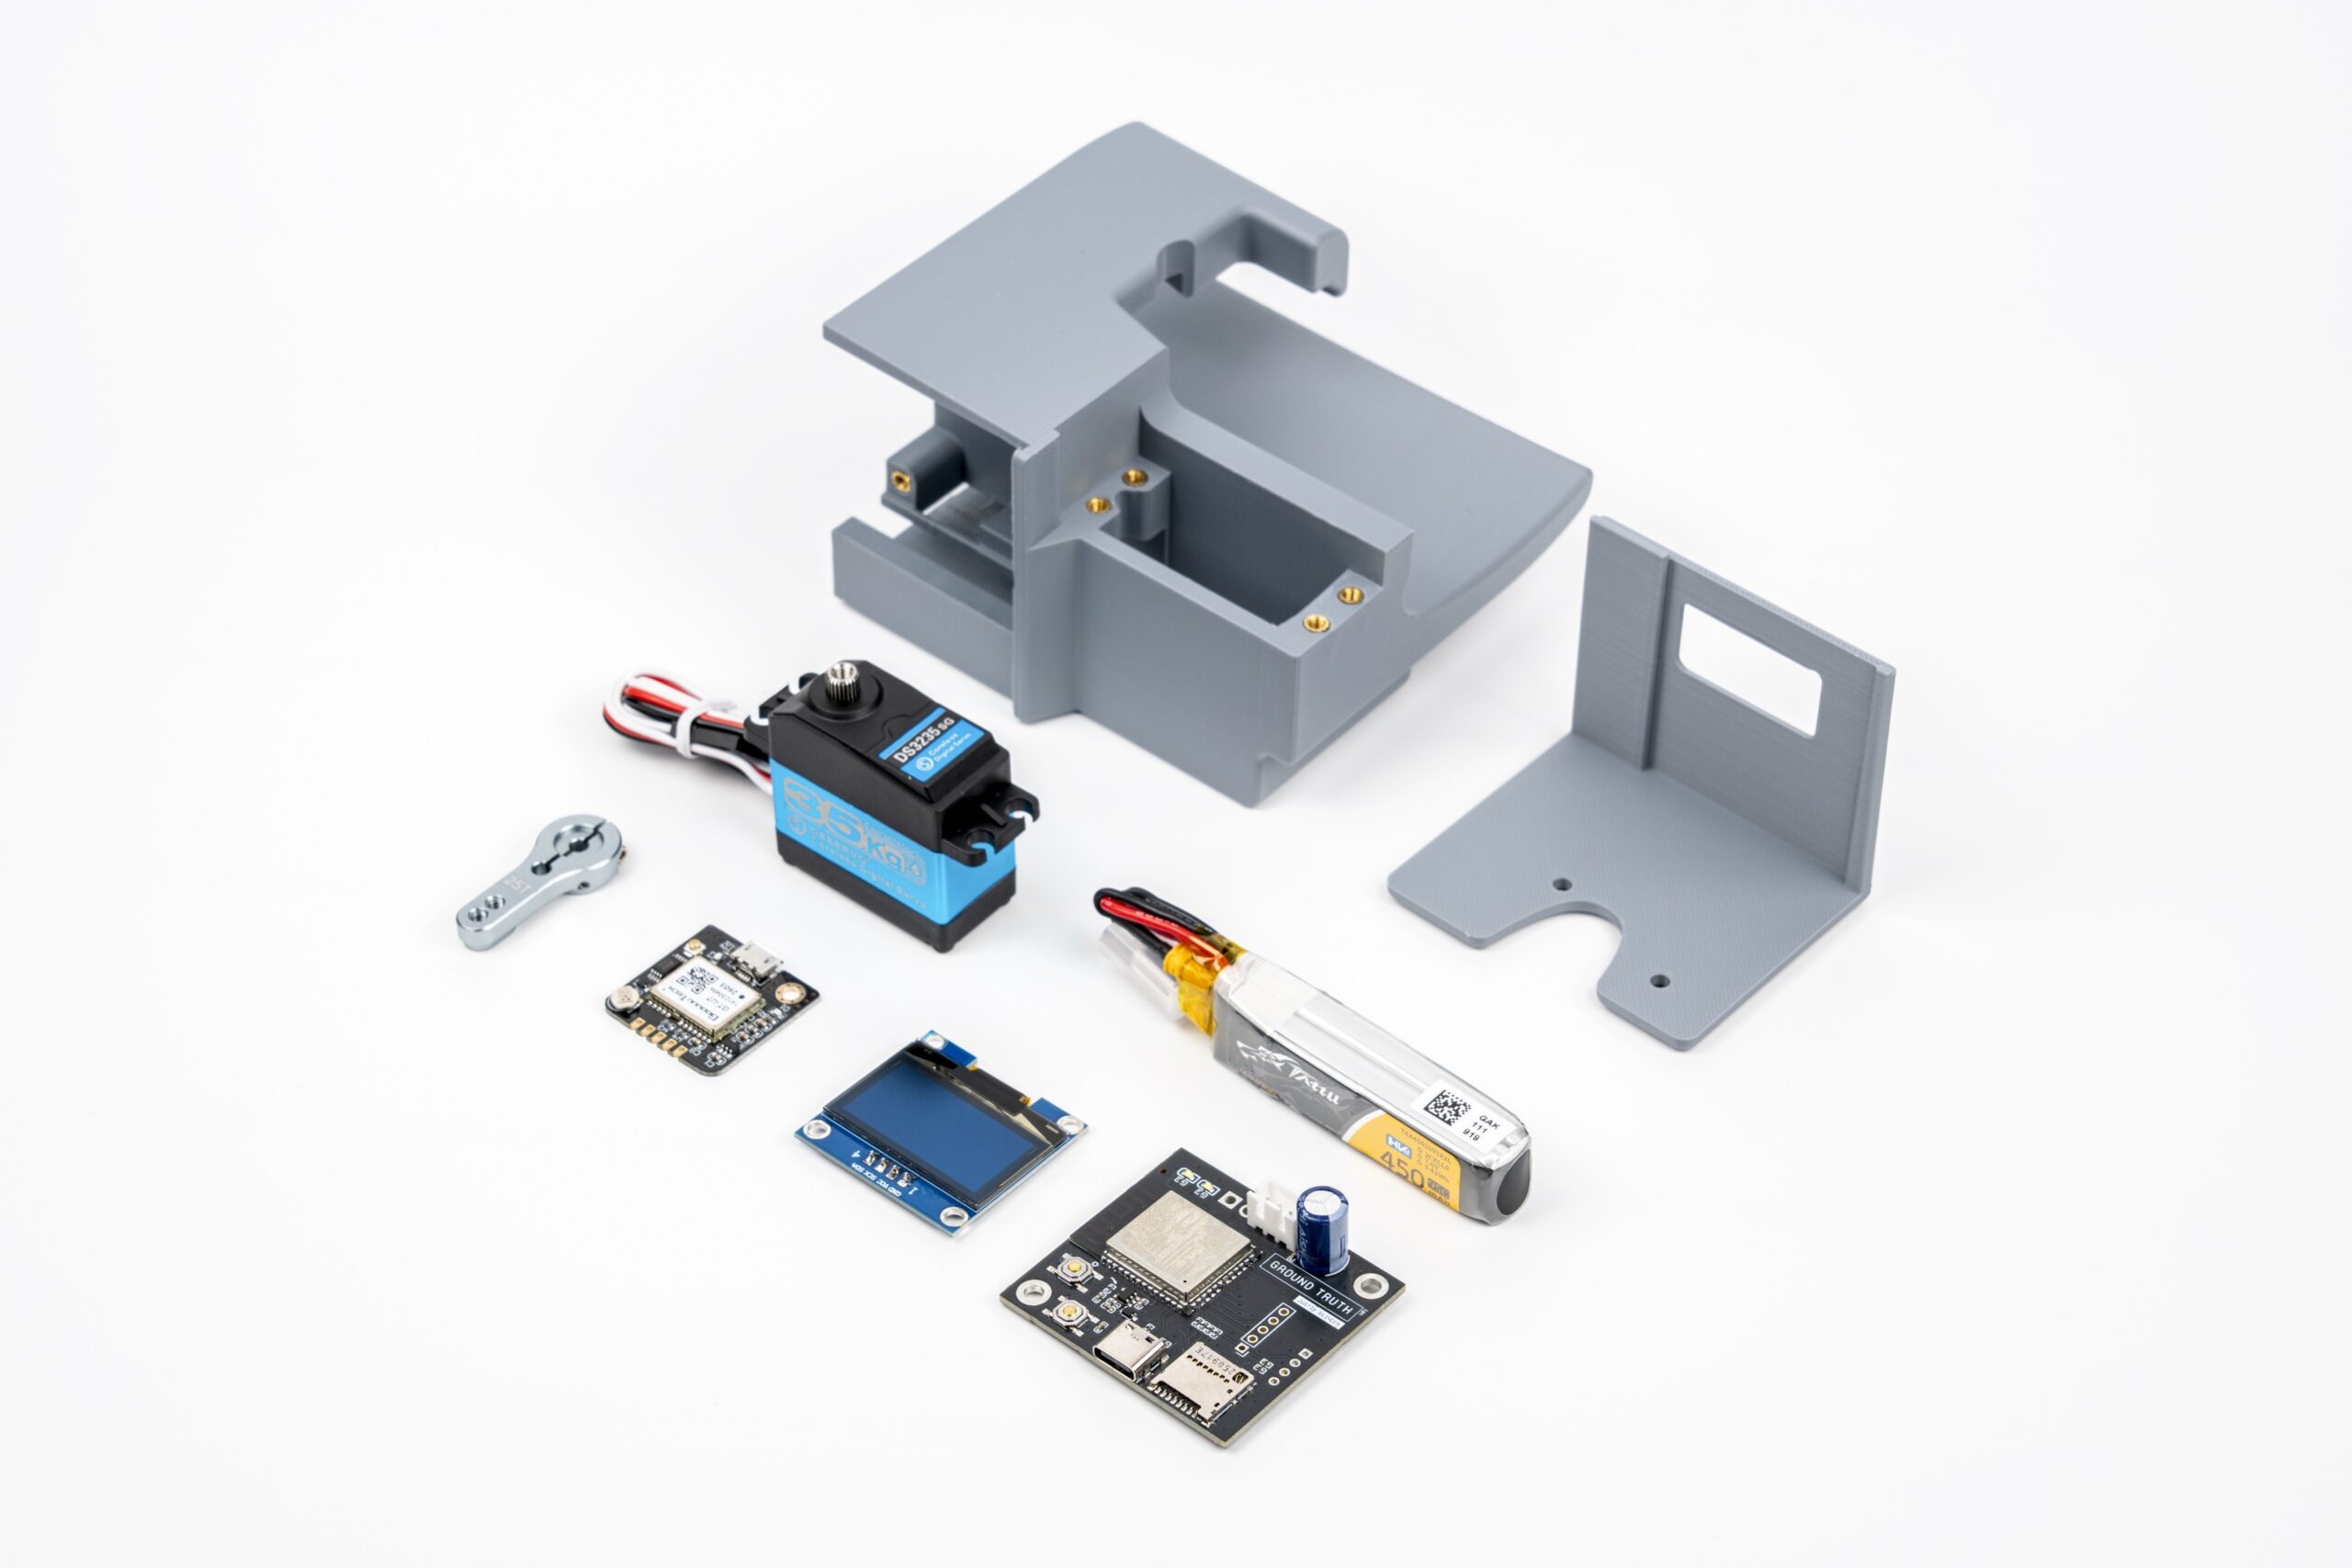
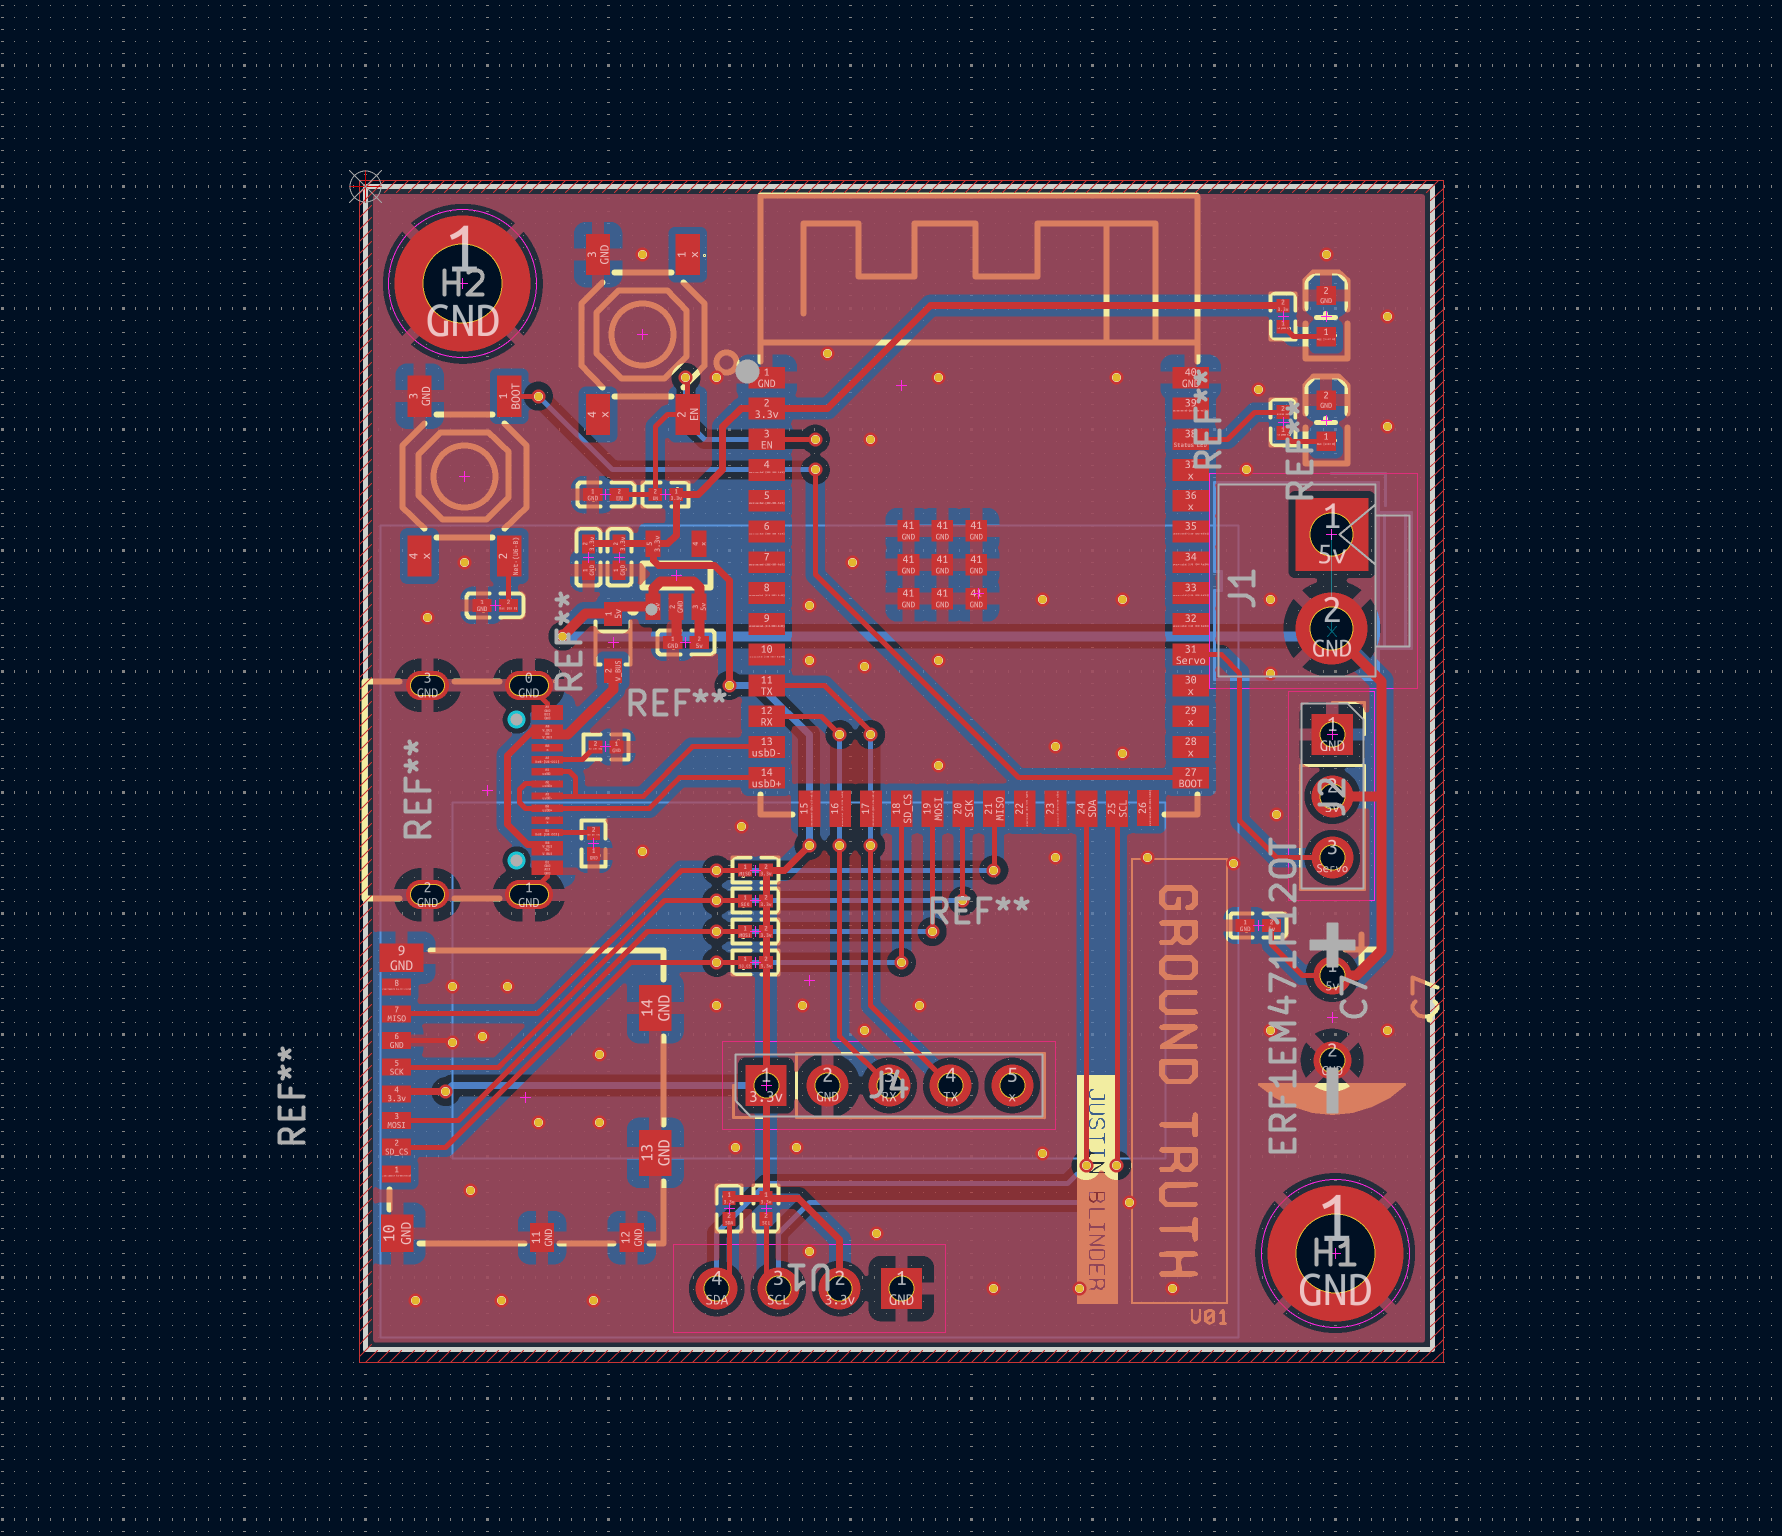
The servo is connected to the bike’s front brake via small wire, applying tension the same way the front brake lever does. In areas with greater housing pressure, it applies more resistance; in more affordable areas, it releases that tension. One of the main technical challenges was calibrating this relationship so that the changes were physically noticeable without feeling abrupt or unsafe. The system needed to respond to the data while still producing a continuous, rideable experience. A core design principle was to create an enclosure that was small enough to house all of the components discreetly, and to quickly attach to a bike while it’s docked, without any additional hardware.
Limits
Instead of simulating housing insecurity, Ground Truth creates a physical glitch: a moment when abstract statistics become embodied resistance.
Ground Truth treats rent burden data ordinarily encountered as a percentage or map as effort. That difficulty does not translate to the lived experiences and hardships of those represented in the data. Friction is used as a catalyst to reflect on what is missing from top-down visualizations, what the data misses, and where our preconceptions and the built environment diverge.
Project Page | Justin Blinder | Instagram
Ground Truth was made possible by the generous support of the Idle Hands Incubation Award.